
About
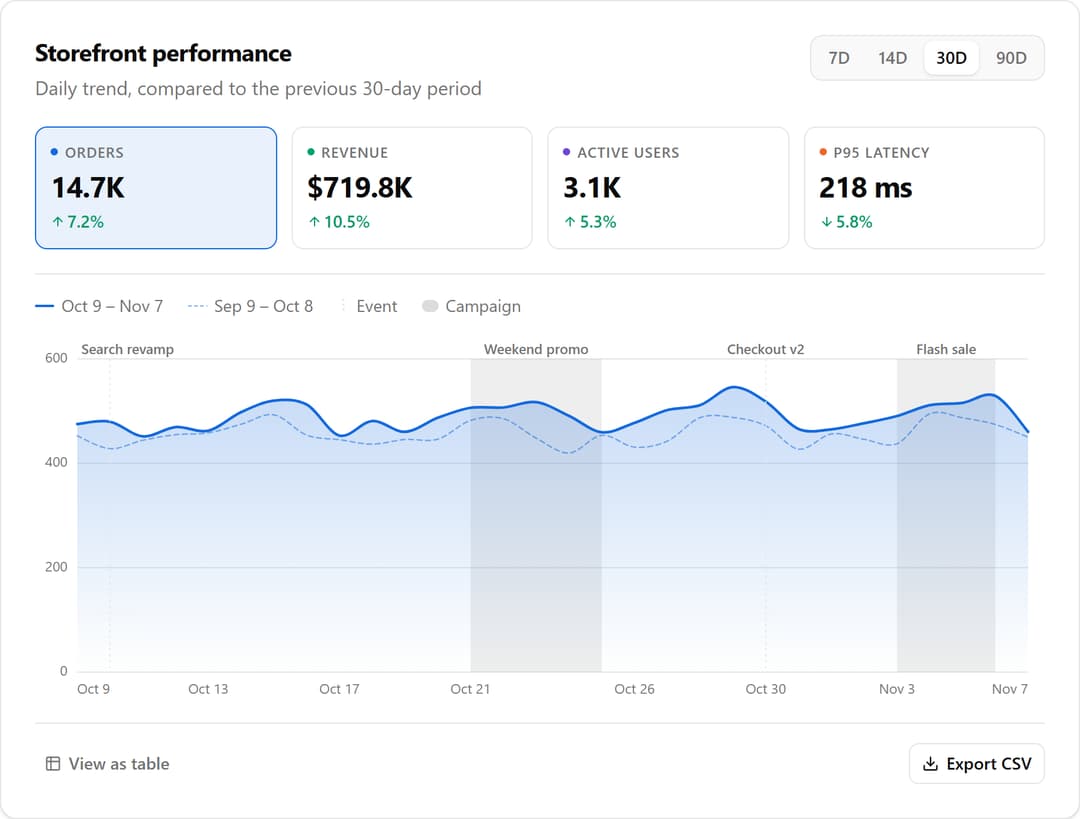
Switchable multi-metric trend chart with previous-period comparison, event annotations, keyboard-accessible readout and CSV export.
Built with React and Tailwind. Copy the prompt and paste it into Claude Code, Cursor or Lovable: your agent adds Metric Trend Chart to your project and fits it to your theme.
Code
How Metric Trend Chart is used: the demo's code. The component's own source comes with a free account.
Usage.tsx
"use client"

import {
  MetricTrendChart,
  type MetricAnnotation,
  type MetricSeries,
} from "@/components/ui/metric-switcher-trend-chart-demo"

/* -------------------------------------------------------------------------- */
/*  Demo data                                                                 */
/*                                                                            */
/*  All content lives here, not in the component. In a real app these arrays   */
/*  come from your analytics API — the component only needs numbers, oldest    */
/*  first, newest last.                                                       */
/* -------------------------------------------------------------------------- */

const TIMELINE_DAYS = 180

/** Tiny deterministic PRNG so the demo renders identically on every load. */
function seededRandom(seed: string) {
  let h = 0
  for (let i = 0; i < seed.length; i++) h = (Math.imul(31, h) + seed.charCodeAt(i)) | 0
  return function next() {
    h |= 0
    h = (h + 0x6d2b79f5) | 0
    let t = Math.imul(h ^ (h >>> 15), 1 | h)
    t = (t + Math.imul(t ^ (t >>> 7), 61 | t)) ^ t
    return ((t ^ (t >>> 14)) >>> 0) / 4294967296
  }
}

/** Trend + weekly seasonality + noise, for believable-looking sample data. */
function makeSeries(options: {
  seed: string
  base: number
  amplitude: number
  trendPerDay: number
  days?: number
}) {
  const { seed, base, amplitude, trendPerDay, days = TIMELINE_DAYS } = options
  const random = seededRandom(seed)
  const values: number[] = []
  let level = base
  for (let i = 0; i < days; i++) {
    level += trendPerDay
    const weekly = Math.sin((i / 7) * Math.PI * 2) * amplitude * 0.35
    const weekend = i % 7 === 5 || i % 7 === 6 ? amplitude * 0.22 : 0
    const noise = (random() - 0.5) * amplitude * 0.4
    values.push(Math.max(0, level + weekly + weekend + noise))
  }
  return values
}

/**
 * `previous[i]` is what slot `i` looked like in the preceding period, so the
 * chart can compare like-for-like however the range changes.
 */
function withComparison(options: Parameters<typeof makeSeries>[0] & { ratio: number }) {
  const current = makeSeries(options)
  const previous = makeSeries({ ...options, seed: `${options.seed}-prev` }).map(
    (v) => v * options.ratio
  )
  return { current, previous }
}

const orders = withComparison({
  seed: "orders",
  base: 420,
  amplitude: 110,
  trendPerDay: 0.4,
  ratio: 0.92,
})
const revenue = withComparison({
  seed: "revenue",
  base: 18_000,
  amplitude: 4_800,
  trendPerDay: 35,
  ratio: 0.9,
})
const users = withComparison({
  seed: "users",
  base: 2_600,
  amplitude: 550,
  trendPerDay: 3,
  ratio: 0.95,
})
const latency = withComparison({
  seed: "latency",
  base: 240,
  amplitude: 55,
  trendPerDay: -0.15,
  ratio: 1.06,
})

const metrics: MetricSeries[] = [
  {
    id: "orders",
    label: "Orders",
    unit: "count",
    aggregate: "sum",
    color: "var(--color-chart-1)",
    ...orders,
  },
  {
    id: "revenue",
    label: "Revenue",
    unit: "currency",
    currency: "USD",
    aggregate: "sum",
    color: "var(--color-chart-2)",
    ...revenue,
  },
  {
    id: "users",
    label: "Active users",
    unit: "count",
    aggregate: "avg",
    color: "var(--color-chart-3)",
    ...users,
  },
  {
    id: "latency",
    label: "p95 latency",
    unit: "ms",
    aggregate: "avg",
    higherIsBetter: false,
    color: "var(--color-chart-4)",
    ...latency,
  },
]

/** The timeline the series are indexed against: `TIMELINE_DAYS` ending today. */
const dates = Array.from({ length: TIMELINE_DAYS }, (_, i) => {
  const d = new Date()
  d.setHours(0, 0, 0, 0)
  d.setDate(d.getDate() - (TIMELINE_DAYS - 1 - i))
  return d
})

/** Annotation positions are indices into that same timeline. */
const daysAgo = (n: number) => TIMELINE_DAYS - 1 - n

const annotations: MetricAnnotation[] = [
  { id: "flash-sale", type: "band", from: daysAgo(4), to: daysAgo(1), label: "Flash sale" },
  { id: "checkout-v2", type: "marker", at: daysAgo(8), label: "Checkout v2" },
  { id: "weekend-promo", type: "band", from: daysAgo(17), to: daysAgo(13), label: "Weekend promo" },
  { id: "search-revamp", type: "marker", at: daysAgo(28), label: "Search revamp" },
  { id: "spring-sale", type: "band", from: daysAgo(56), to: daysAgo(50), label: "Spring clearance" },
  { id: "mobile-v3", type: "marker", at: daysAgo(75), label: "Mobile app v3" },
]

/**
 * Live controls for the 21st.dev preview panel: every key becomes a knob, and
 * "Copy code" writes the visitor's values straight back into this object.
 */
const settings = {
  title: "Storefront performance",
  chartHeight: 260,
  showComparison: true,
  showAnnotations: true,
  showTable: true,
  showExport: true,
  zeroBaseline: true,
}

export default function MetricTrendChartDemo(props: Partial<typeof settings>) {
  const s = { ...settings, ...props }

  return (
    <div className="flex w-full items-center justify-center p-4 sm:p-8">
      <div className="w-full max-w-4xl">
        <MetricTrendChart
          title={s.title}
          metrics={metrics}
          dates={dates}
          annotations={s.showAnnotations ? annotations : []}
          defaultMetricId="orders"
          defaultRangeId="30d"
          height={Math.max(140, Math.round(s.chartHeight))}
          showComparison={s.showComparison}
          showTable={s.showTable}
          showExport={s.showExport}
          yAxis={s.zeroBaseline ? "zero" : "auto"}
        />
      </div>
    </div>
  )
}
Dependencies
More by WRAPCODERS
View all

Real Estate 3D Hero
23
Interactive 3D Hero Header
2
AI SaaS Workflow Hero
Minimal Pricing Plan

Portfolio Projects Showcase

App Integration Celestial Hero

Minimal Isometric Cloud Hero
Admin Dashboard Cards
More in Dashboards
View all
Dashboard with Collapsible Sidebar
2.6K
Stat Card
46

Sidebar
392

Chart Component
11

SaaS Template
2.7K

Fitness Bento Grid
42

Financial Bento Grid
129

Course Design Cards
1.3K

