
About
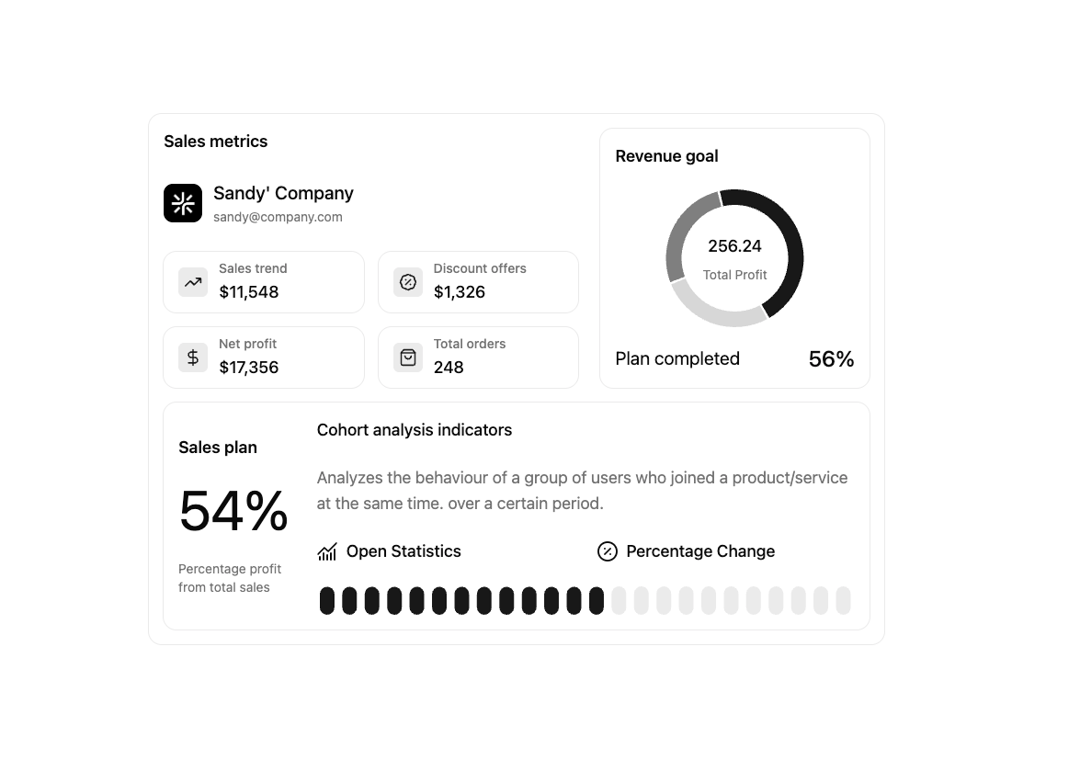
Responsive sales metrics dashboard card with donut and bar charts by Shadcn Studio.
Built with React and Tailwind. Copy the prompt and paste it into Claude Code, Cursor or Lovable: your agent adds Chart Component to your project and fits it to your theme.
Code
How Chart Component is used: the demo's code. The component's own source comes with a free account.
Usage.tsx
import {
  BadgePercentIcon,
  ChartNoAxesCombinedIcon,
  CirclePercentIcon,
  DollarSignIcon,
  ShoppingBagIcon,
  TrendingUpIcon
} from 'lucide-react'

import SalesMetricsCard, {
  type CohortIndicator,
  type RevenueSlice,
  type SalesMetric
} from '@/components/ui/shadcn-studio-chart-component-01'

const metrics: SalesMetric[] = [
  { icon: TrendingUpIcon, title: 'Sales trend', value: '$11,548' },
  { icon: BadgePercentIcon, title: 'Discount offers', value: '$1,326' },
  { icon: DollarSignIcon, title: 'Net profit', value: '$17,356' },
  { icon: ShoppingBagIcon, title: 'Total orders', value: '248' }
]

const revenueSlices: RevenueSlice[] = [
  { id: 'january', label: 'January', value: 340, strength: 100 },
  { id: 'february', label: 'February', value: 200, strength: 60 },
  { id: 'march', label: 'March', value: 200, strength: 20 }
]

const cohortIndicators: CohortIndicator[] = [
  { icon: ChartNoAxesCombinedIcon, label: 'Open Statistics' },
  { icon: CirclePercentIcon, label: 'Percentage Change' }
]

const WidgetCardPreview = () => {
  return (
    <div className='py-8 sm:py-16 lg:py-24'>
      <div className='mx-auto max-w-7xl px-4 sm:px-6 lg:px-8'>
        <div className='flex justify-center'>
          <SalesMetricsCard
            className='w-full max-w-200'
            company={{
              name: "Sandy' Company",
              email: '[email protected]',
              logoSrc: 'https://cdn.21st.dev/assets/mirror/cd/cd7118f927830970cbbc37dc462c53fab49011b6c0768c894974c00a158383ed.png'
            }}
            metrics={metrics}
            revenueSlices={revenueSlices}
            revenueTotal='256.24'
            planCompleted={56}
            salesPlanPercentage={54}
            cohortDescription='Analyzes the behaviour of a group of users who joined a product/service at the same time. over a certain period.'
            cohortIndicators={cohortIndicators}
          />
        </div>
      </div>
    </div>
  )
}

export default WidgetCardPreview
Dependencies
More by Clevision
View all

Syntra Hero
164
Calendar
111
Card Studio
108
Hero Section 41
60
Agency Hero
52
Hero Section
44
Collapsible
43
Logo Cloud
42
More in Dashboards
View all
Dashboard with Collapsible Sidebar
2.6K
Stat Card
45

Sidebar
391

SaaS Template
2.7K

Fitness Bento Grid
41

Financial Bento Grid
129

Course Design Cards
1.3K

Glassy Dashboard
209

