
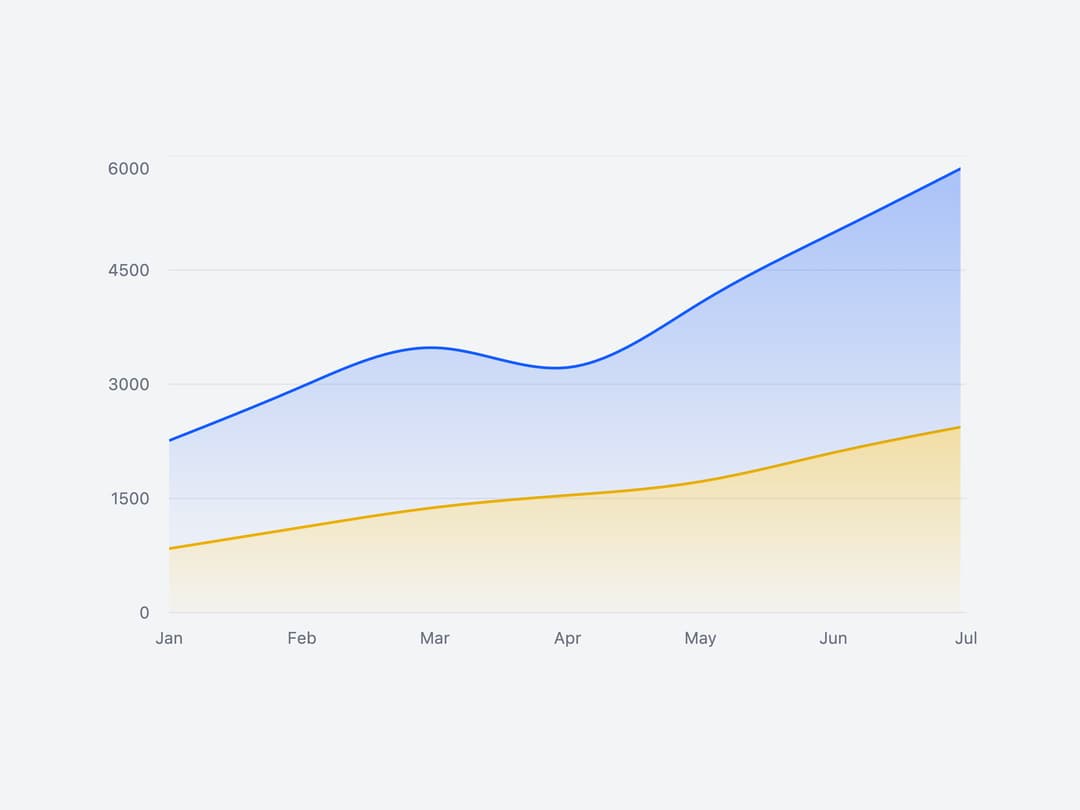
About
A gradient-filled stacked area chart for comparing two time-series metrics, like inbound vs outbound traffic, with an interactive tooltip.
Built with React and Tailwind. Copy the prompt and paste it into Claude Code, Cursor or Lovable: your agent adds Chart Area to your project and fits it to your theme.
Code
How Chart Area is used: the demo's code. The component's own source comes with a free account.
Usage.tsx
import ChartArea from "@/components/ui/chart-area";

export default function ChartAreaDemo() {
  return (
    <div className="w-full max-w-2xl p-4">
      <ChartArea />
    </div>
  );
}
Dependencies
More by uiable
View all

Feature Highlights Grid
512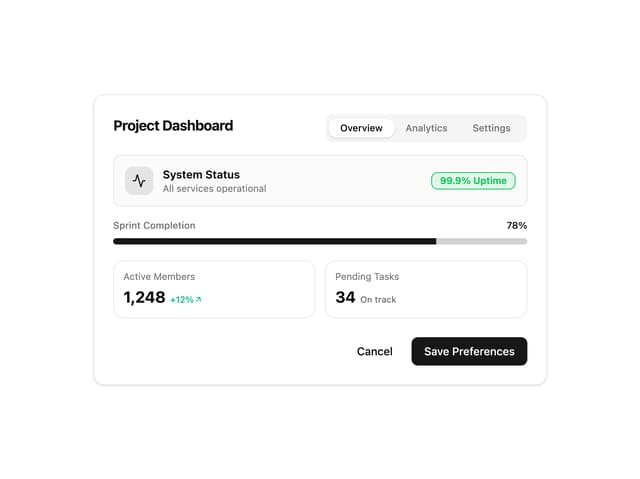
Card Tabs
142
Financial Bento Grid
129
Portfolio Showcase Grid
90
Marketing Hero Section
89
Chart Tooltip
89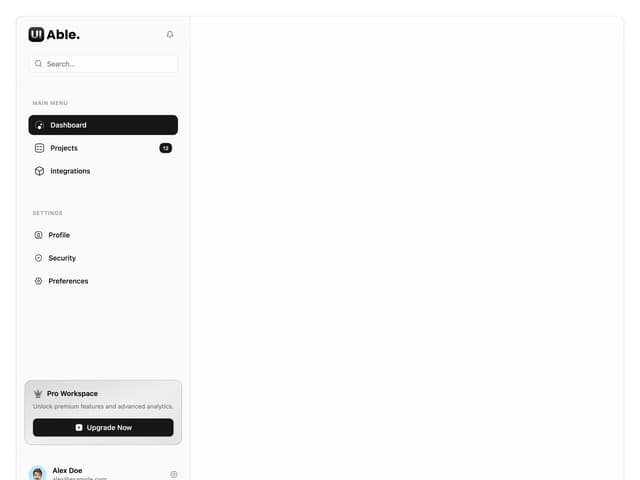
Sidebar with Search and Profile
79
Attachment States
58
More in Dashboards
View all
Dashboard with Collapsible Sidebar
2.6K
Stat Card
46

Sidebar
392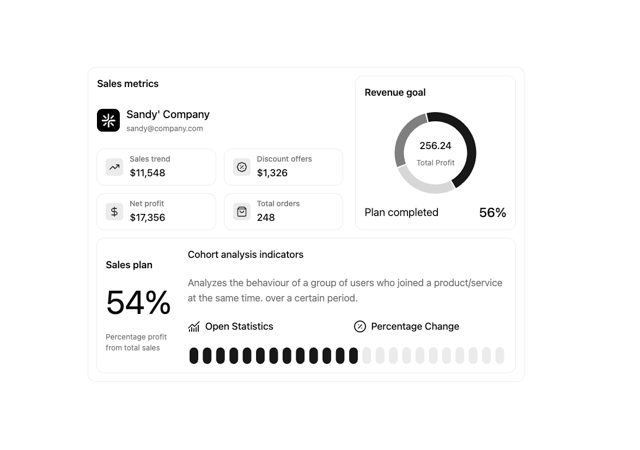

Chart Component
11

SaaS Template
2.7K

Fitness Bento Grid
42

Course Design Cards
1.3K

Glassy Dashboard
223

