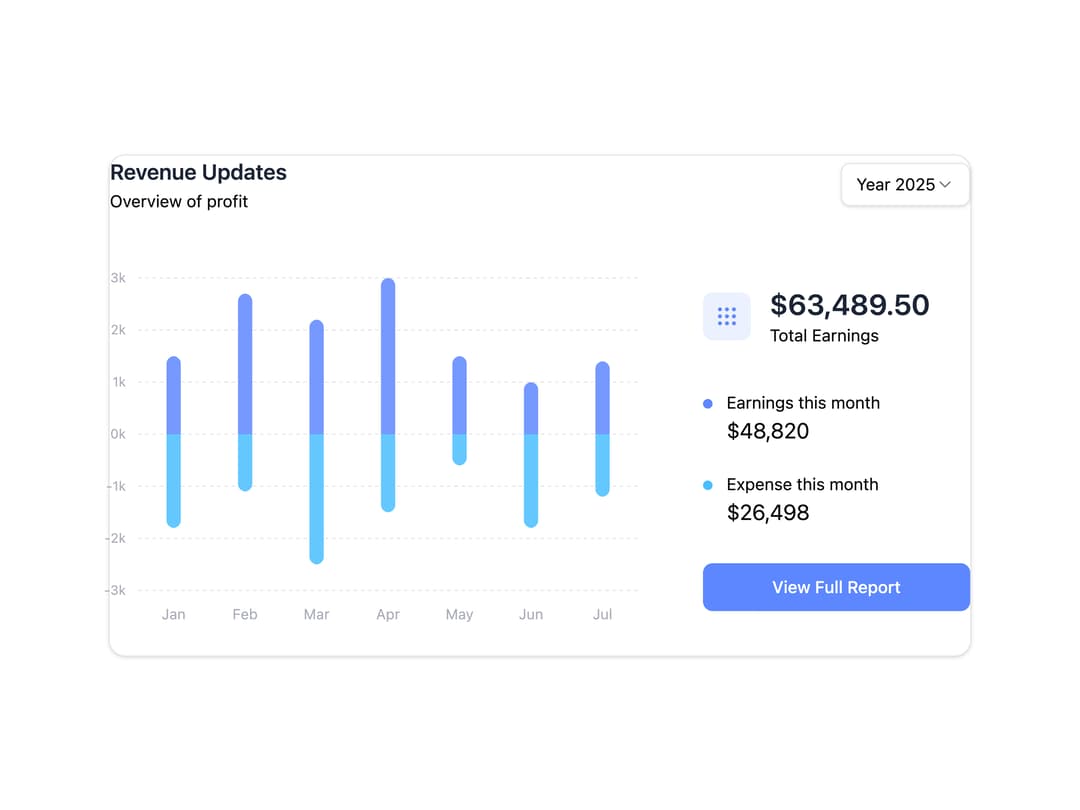
About
A dashboard card that shows a stacked bar chart of monthly earnings vs expenses with a year selector and a total earnings summary.
Built with React and Tailwind. Copy the prompt and paste it into Claude Code, Cursor or Lovable: your agent adds Revenue Updates Chart to your project and fits it to your theme.
Code
How Revenue Updates Chart is used: the demo's code. The component's own source comes with a free account.
Usage.tsx
import RevenueUpdatesChart from "@/components/ui/revenue-updates-chart";

export default function RevenueUpdatesChartDemo() {
  return (
    <div className="w-full max-w-3xl p-6">
      <RevenueUpdatesChart />
    </div>
  );
}
Dependencies
More by tailwind-admin
View all
Dot Loader Motion
24
Task List Card
22
Animate Table Motion
21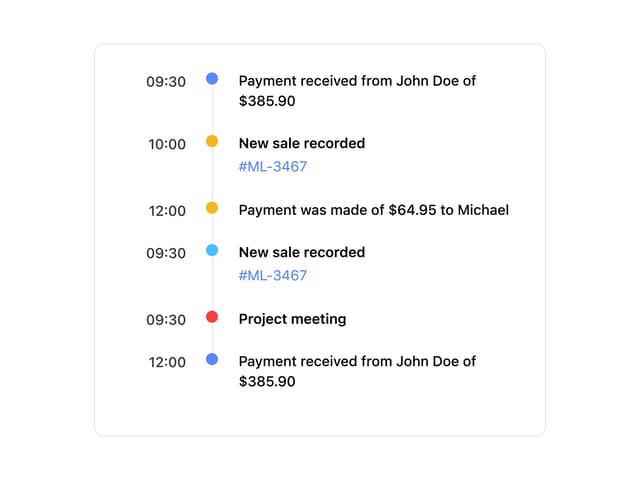
Action Tracking Timeline
1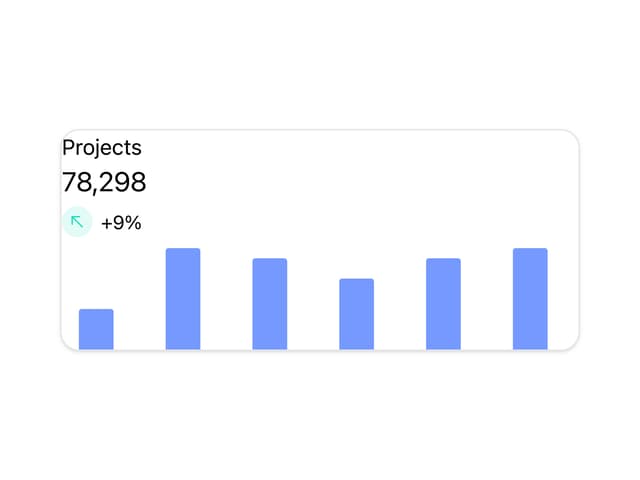
Projects Sparkline Chart Card
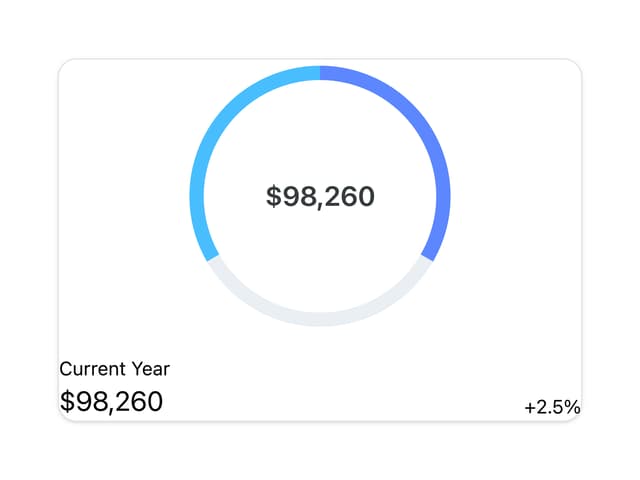
Current Year Chart
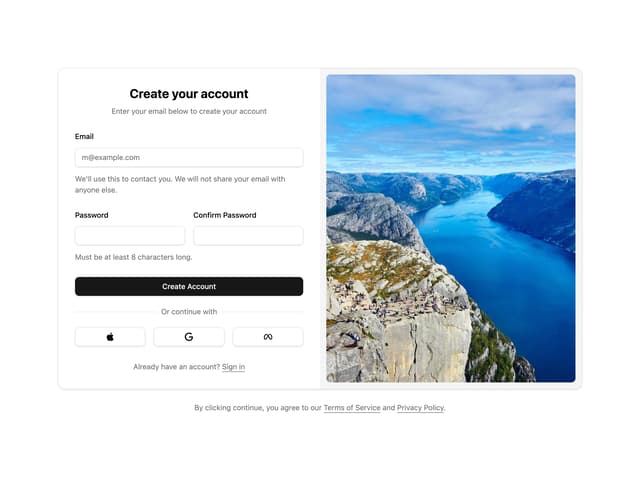
Signup Form Split
Elastic Slider Motion
More in Dashboards
View all
Dashboard with Collapsible Sidebar
2.6K
Stat Card
46

Sidebar
392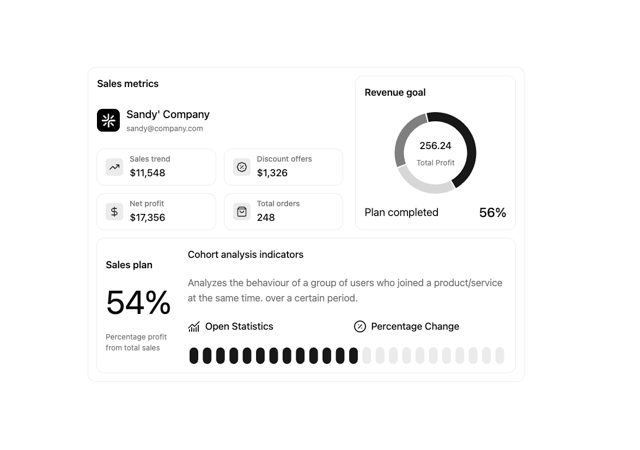

Chart Component
11

SaaS Template
2.7K

Fitness Bento Grid
42

Financial Bento Grid
129

Course Design Cards
1.3K

