
About
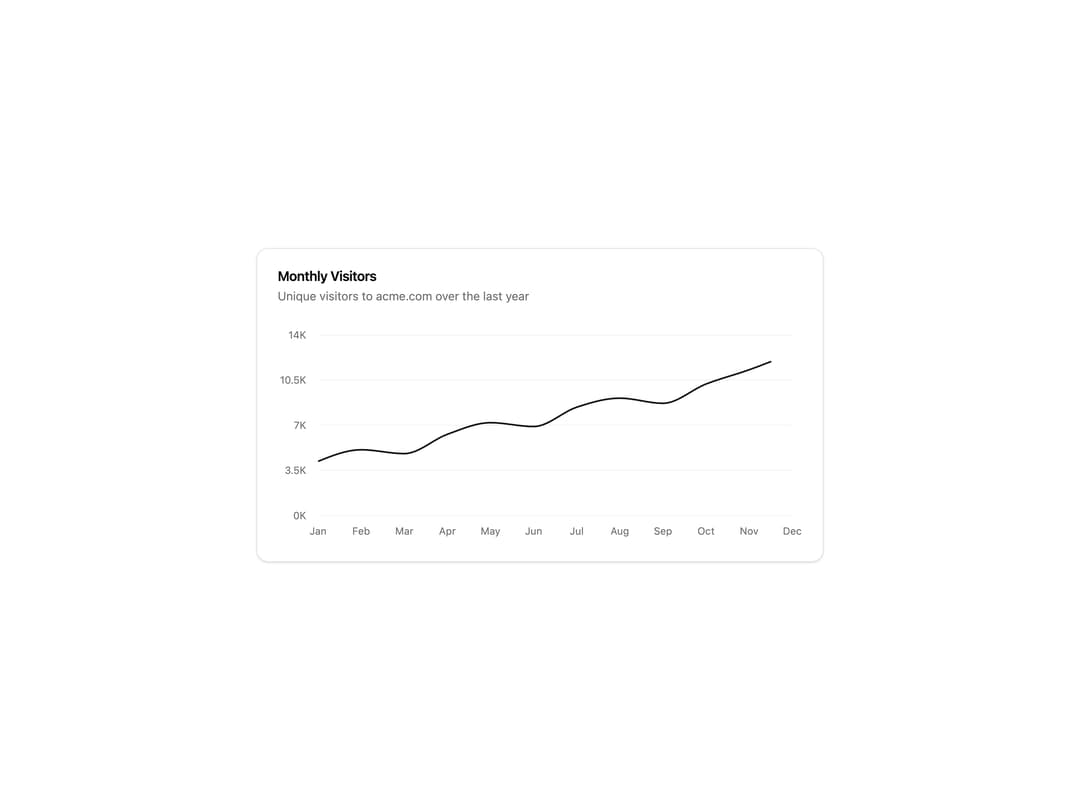
A card that plots unique website visitors month by month on a line chart, with a grid, labelled axes, and a hover tooltip on each point.
Built with React and Tailwind. Copy the prompt and paste it into Claude Code, Cursor or Lovable: your agent adds Monthly Visitors Line Chart to your project and fits it to your theme.
Code
How Monthly Visitors Line Chart is used: the demo's code. The component's own source comes with a free account.
Usage.tsx
import ChartsBlock from "@/components/ui/charts-4";

export default function ChartsDemo() {
  return <ChartsBlock />;
}
Dependencies
More by 7Ovr - Oliver
View all

Dismissible Alert Stack
460
Us vs Them Comparison
356
Feature Comparison Table
289
Team Members Data Table
224
How It Works Timeline
222
Alternating Rows With Stats
119
Logo Cloud Marquee
118
Activity Timeline
112
More in Dashboards
View all
Dashboard with Collapsible Sidebar
2.6K
Stat Card
46

Sidebar
392

Chart Component
11

SaaS Template
2.7K

Fitness Bento Grid
42

Financial Bento Grid
129

Course Design Cards
1.3K

