
About
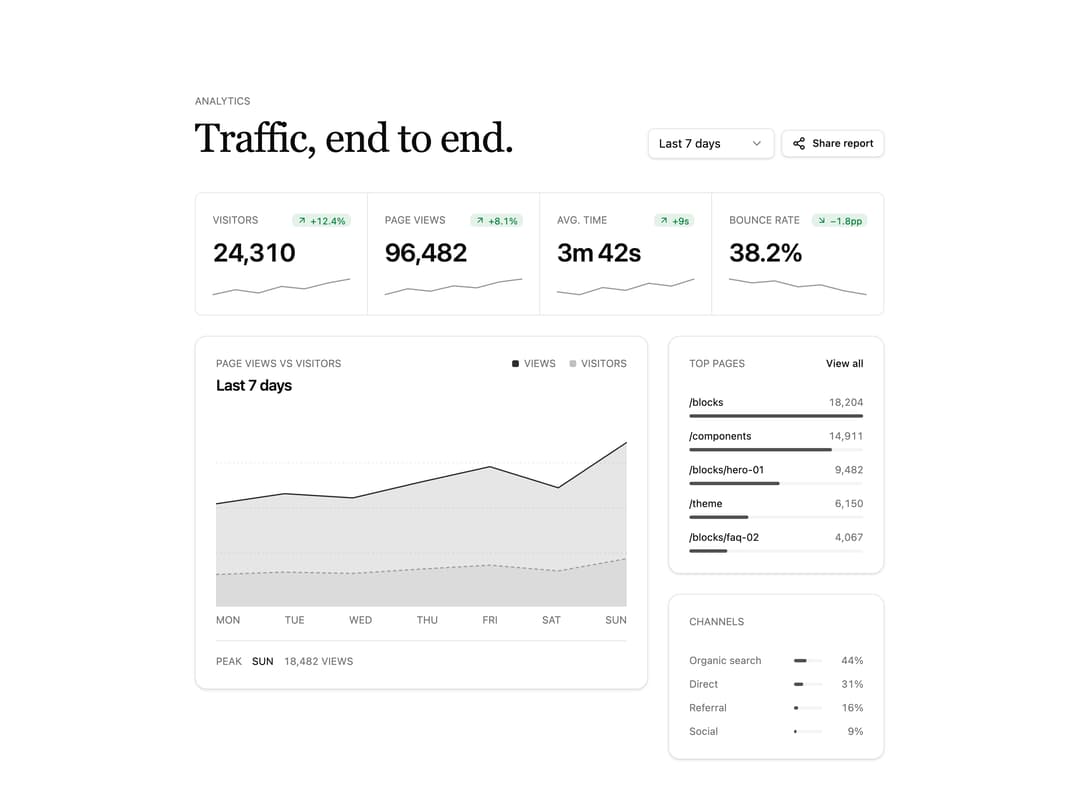
Analytics dashboard with a date-range select, four sparkline KPI tiles, a layered two-series area chart and top-pages and channel-share side cards. Deltas carry their own unit (percent vs percentage points) and the direction that counts as good, and the area chart ships a screen-reader data table of the same numbers.
Built with React and Tailwind. Copy the prompt and paste it into Claude Code, Cursor or Lovable: your agent adds Analytics Dashboard to your project and fits it to your theme.
Code
How Analytics Dashboard is used: the demo's code. The component's own source comes with a free account.
Usage.tsx
import Dashboard02 from "@/components/ui/dashboard-02";

export default function DashboardDemo() {
  return <Dashboard02 />;
}
Dependencies
More by Mohammad Shehadeh
View all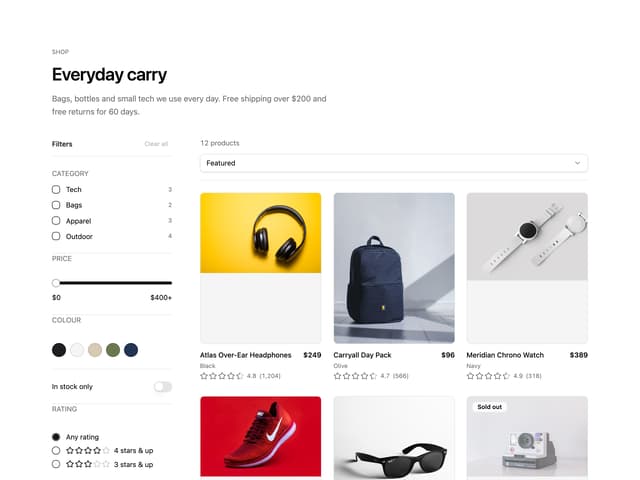
Ecommerce Category Page
99
Feature Problem Cards
99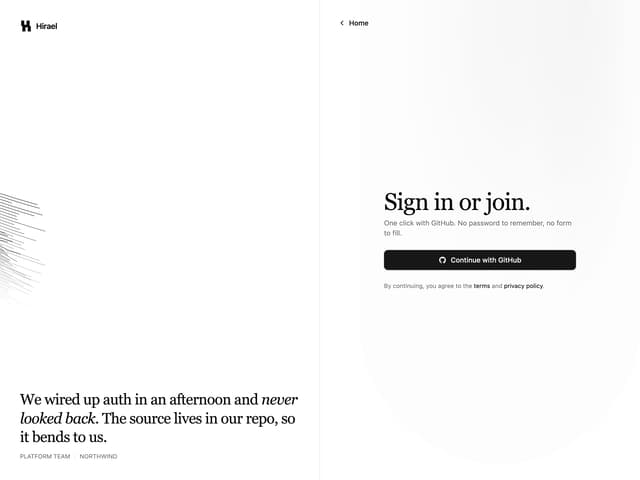
Split Login
93
Feature Grid Spotlight Cards
90
Comparison Section
81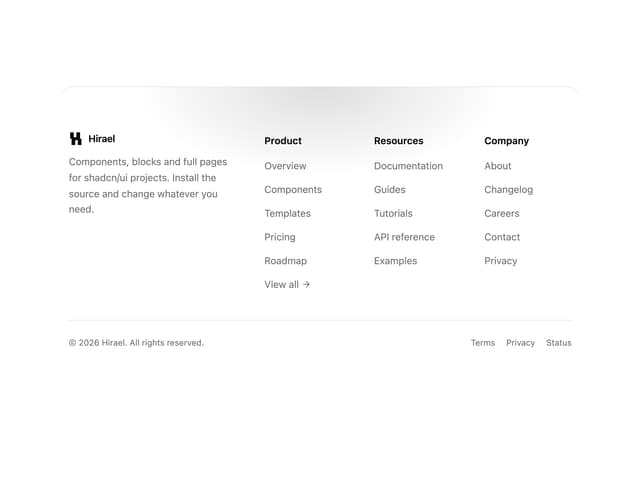
Rounded Top Footer
79
Comparison Table
77
FAQ Two Column
76
More in Dashboards
View all
Dashboard with Collapsible Sidebar
2.6K
Stat Card
45

Sidebar
391

Chart Component
10

SaaS Template
2.7K

Fitness Bento Grid
40

Financial Bento Grid
128

Course Design Cards
1.3K

