
About
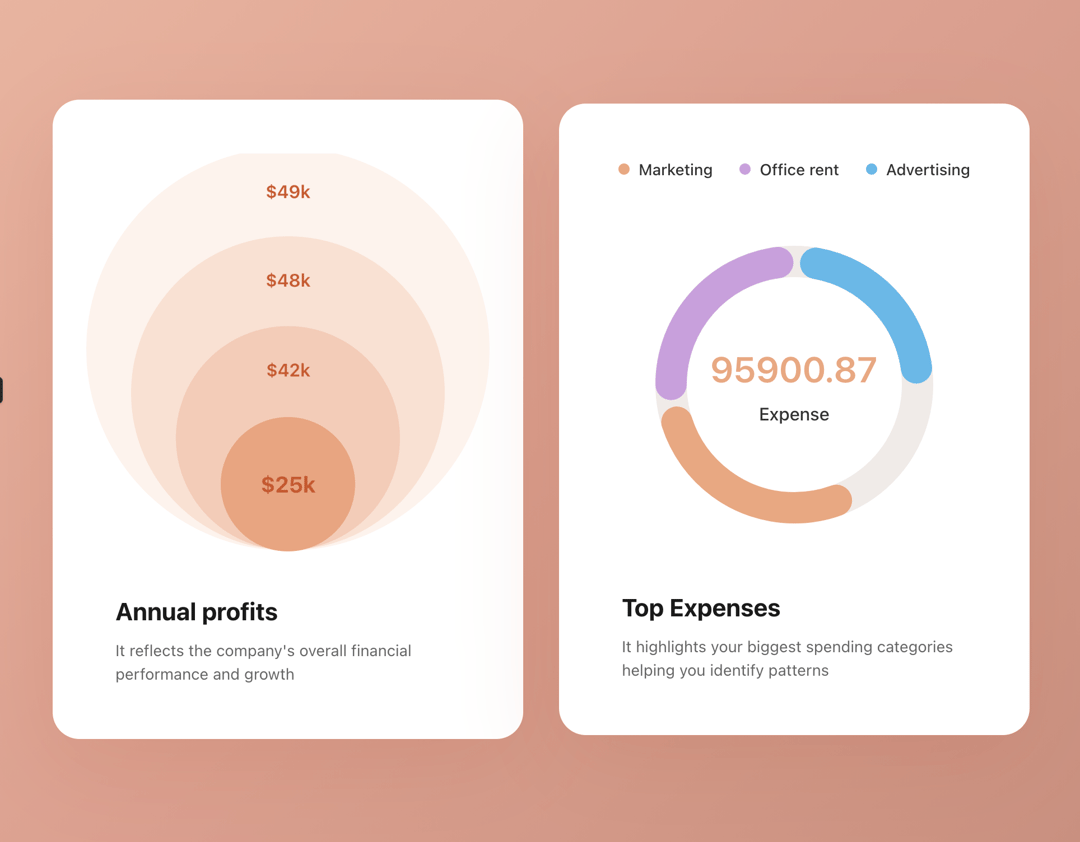
Animated financial metrics displaying annual profits and expense breakdown with interactive visualizations.
Built with React and Tailwind. Copy the prompt and paste it into Claude Code, Cursor or Lovable: your agent adds Dashboard Metrics to your project and fits it to your theme.
Code
How Dashboard Metrics is used: the demo's code. The component's own source comes with a free account.
Usage.tsx
import { Dashboard } from "@/components/ui/dashboard-metrics";

export default function DemoOne() {
  return <Dashboard />;
}
More by Le Thanh
View all
Interactive Image Accordion
4.4K
Interactive Selector
2.8K
Gradient Menu
2.4K
Animated Shader Background
2.1K
Shader Background
2K
Waitlist Hero
1.8K
Image Comparison Slider
1.6K
Login Form
1.5K
More in Dashboards
View all
Dashboard with Collapsible Sidebar
2.6K
Stat Card
46

Sidebar
392

Chart Component
11

SaaS Template
2.7K

Fitness Bento Grid
42

Financial Bento Grid
129

Course Design Cards
1.3K

