
About
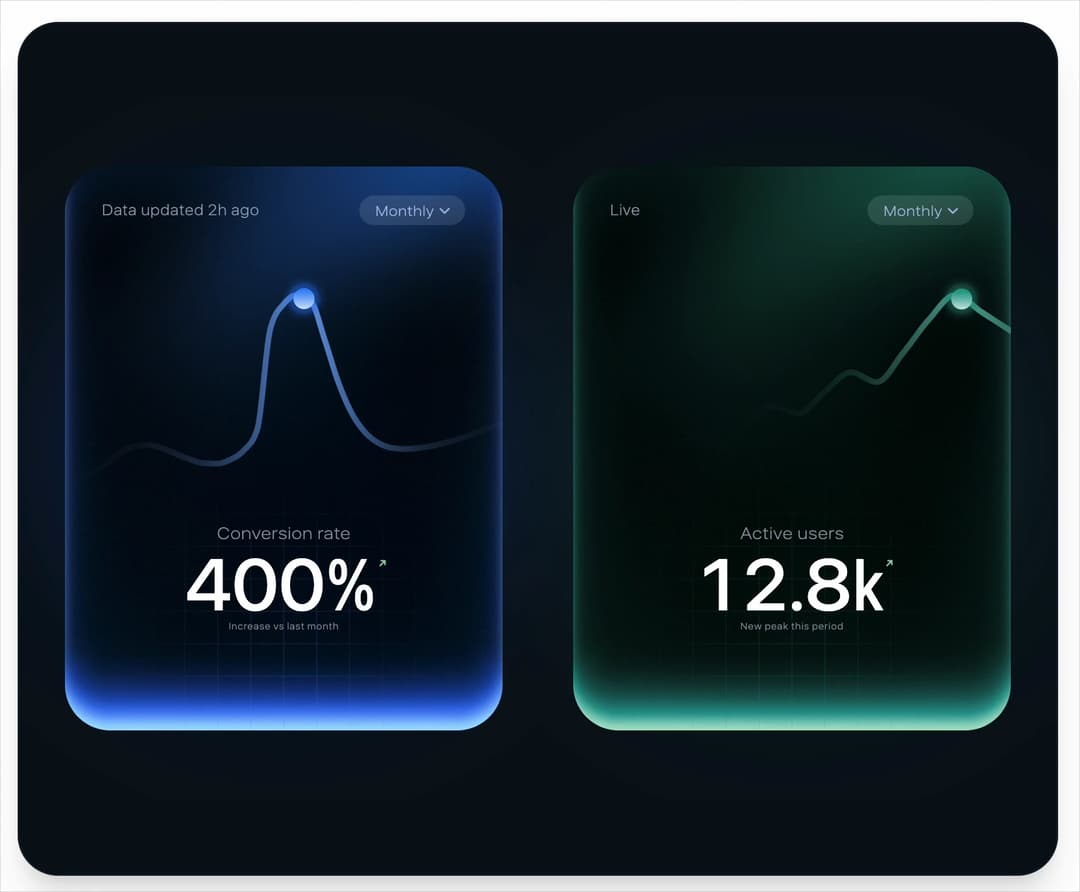
A glowing navy stat card whose blue line chart draws in, lands a pulsing dot on its peak and counts the headline figure up, with live hover. More like this, plus a designer your coding agent can use, at studios.lou15.com/?ref=21st
Built with React and Tailwind. Copy the prompt and paste it into Claude Code, Cursor or Lovable: your agent adds Peak Chart to your project and fits it to your theme.
Code
How Peak Chart is used: the demo's code. The component's own source comes with a free account.
Usage.tsx
"use client"

import * as React from "react"
import { PeakChart } from "@/components/ui/peak-chart"

// A second card fed its own series through props. Picking a period swaps the data, which morphs the line.
const USERS: Record<string, { data: number[]; labels: string[]; value: number }> = {
  Weekly: {
    data: [8.1, 8.6, 9.4, 9.1, 10.8, 12.4, 11.9],
    labels: ["Mon", "Tue", "Wed", "Thu", "Fri", "Sat", "Sun"],
    value: 12.4,
  },
  Monthly: {
    data: [5.2, 5.6, 5.4, 6.1, 6.9, 6.6, 7.4, 8.2, 7.9, 8.8, 9.6, 9.2, 10.4, 11.8, 12.8, 12.1],
    labels: Array.from({ length: 16 }, (_, i) => `Day ${i * 2 + 1}`),
    value: 12.8,
  },
  Yearly: {
    data: [2.1, 2.4, 3.2, 3.0, 4.1, 4.8, 5.6, 6.3, 7.9, 9.4, 11.2, 12.8],
    labels: ["Jan", "Feb", "Mar", "Apr", "May", "Jun", "Jul", "Aug", "Sep", "Oct", "Nov", "Dec"],
    value: 12.8,
  },
}

// Cards are sized from the frame before the first paint: side by side when it is wide, stacked
// when it is tall, never wider than the frame allows so the glow stays inside the panel.
function measure() {
  if (typeof window === "undefined") return { width: 280, tall: false }
  const vw = window.innerWidth
  const vh = window.innerHeight
  const tall = vh > vw * 1.2
  const width = tall
    ? Math.min(vw - 96, (vh - 110) / 2 / 1.289)
    : Math.min((vw - 150) / 2, (vh - 70) / 1.289, 400)
  return { width: Math.max(160, Math.round(width)), tall }
}

function useFit() {
  const [fit, setFit] = React.useState(measure)
  React.useEffect(() => {
    const update = () => setFit(measure())
    window.addEventListener("resize", update)
    return () => window.removeEventListener("resize", update)
  }, [])
  return fit
}

/**
 * Two cards, one component: the default conversion card in its reference blue, and an active users
 * card with its own accent, series, labels, headline and period handling. Every difference is a prop.
 */
export default function PeakChartDemo() {
  const { width, tall } = useFit()
  const [period, setPeriod] = React.useState("Monthly")
  const users = USERS[period]

  return (
    <main className="relative min-h-screen w-full bg-background">
      <section
        className="absolute flex items-center justify-center overflow-hidden shadow-xl"
        style={{
          inset: "clamp(10px, 2.6vmin, 26px)",
          borderRadius: "clamp(18px, 4.5vmin, 34px)",
          border: "1px solid rgba(140, 170, 230, 0.1)",
          backgroundColor: "#08101a",
          flexDirection: tall ? "column" : "row",
          gap: tall ? Math.round(width * 0.1) : Math.round(width * 0.16),
        }}
      >
        <PeakChart width={width} />
        <PeakChart
          width={width}
          accent="#2ec99a"
          data={users.data}
          labels={users.labels}
          value={users.value}
          valueSuffix="k"
          decimals={1}
          title="Active users"
          caption="New peak this period"
          updatedText="Live"
          period={period}
          onPeriodChange={setPeriod}
          formatValue={(v) => `${v.toFixed(1)}k`}
        />
      </section>
    </main>
  )
}
More by Louis Studios
View all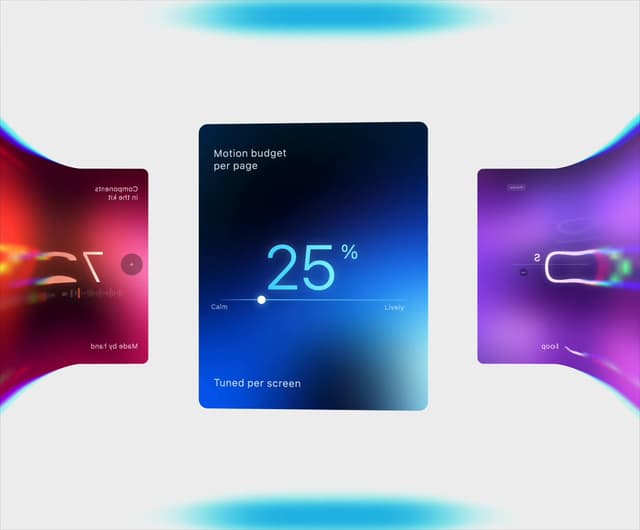

Warp Carousel
1.1K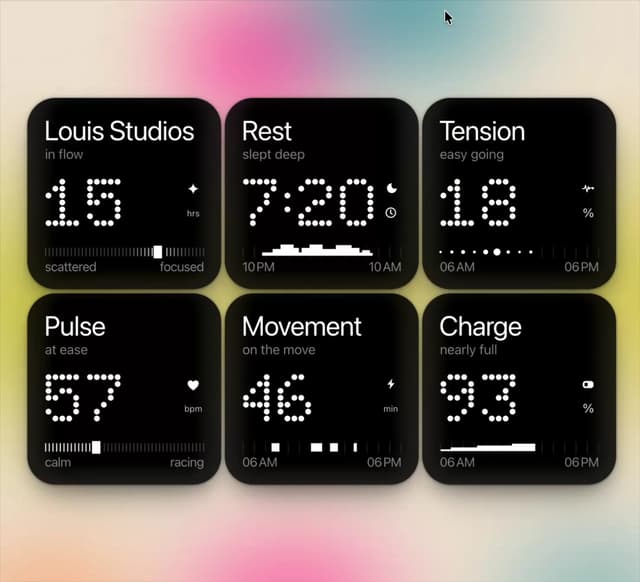
Dot Tiles
168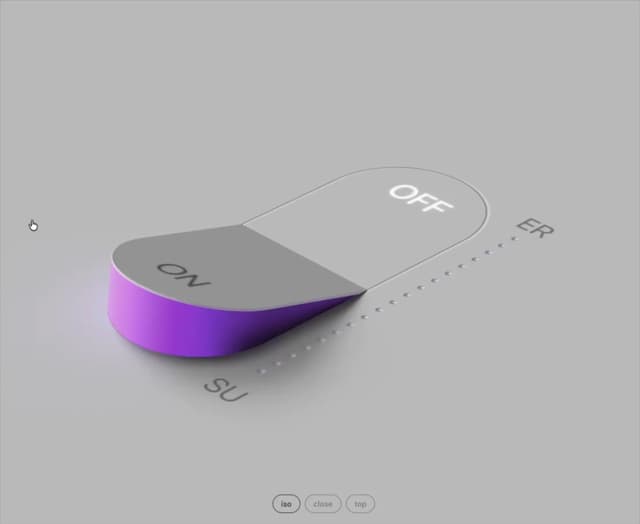
Glow Rocker
156
Cover Flow
126
Chapter Player
124
Chrome Arcs
124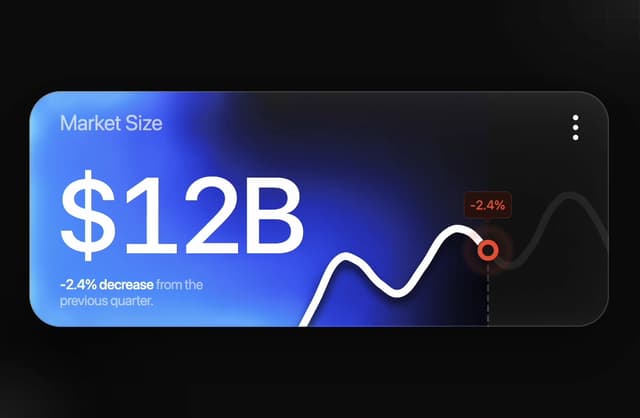
Market Card
106
LED Badges
96
More in Cards
View all

Course Design Cards
1.3K

Statistics Card 7
327
Statistics Card 2
305

Interactive Tech Stack Bento Grid with Hover Effects
625

Card Studio
5
The Item one
4

Weather Card
65

Card
9