
About
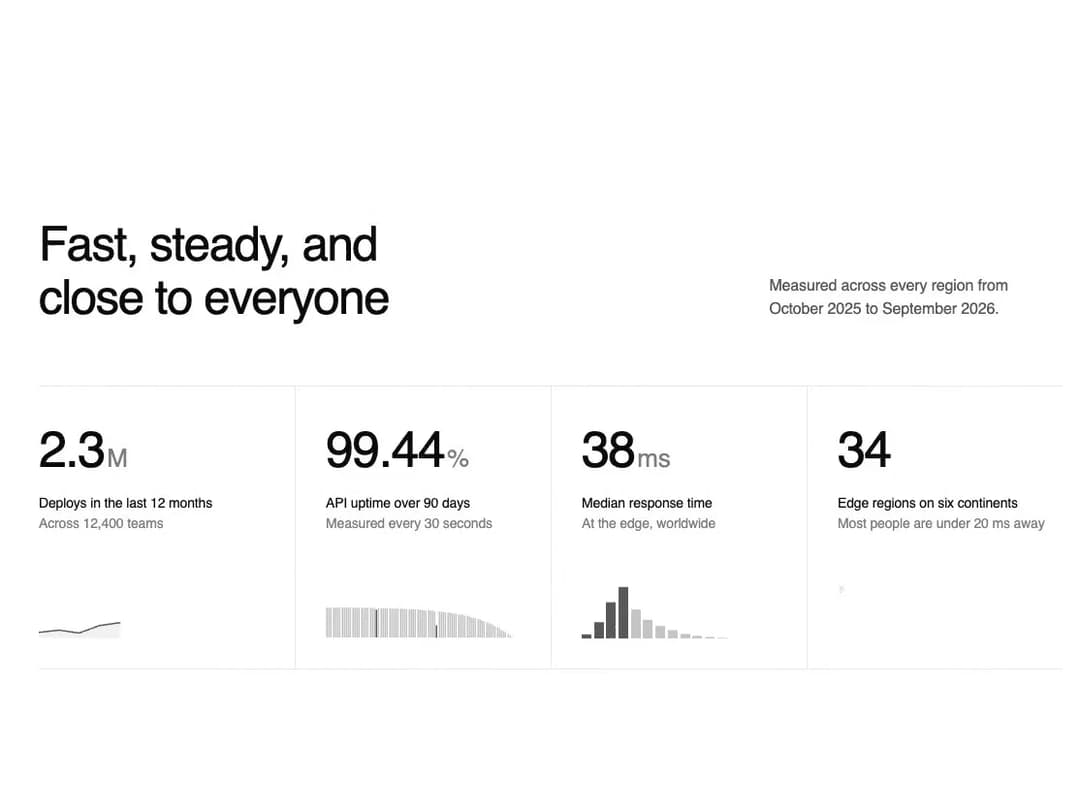
A row of headline statistics that count up into view, each with a tiny inline chart (trend line, uptime bars, histogram, or dotted world map) and a hover-revealed context line, laid out plain or in a hairline grid.
Built with React and Tailwind. Copy the prompt and paste it into Claude Code, Cursor or Lovable: your agent adds Stats Band to your project and fits it to your theme.
Code
How Stats Band is used: the demo's code. The component's own source comes with a free account.
Usage.tsx
import StatsBand from "@/components/ui/stats-band";

export default function StatsBandDemo() {
  return (
    <div className="w-full">
      <StatsBand
        layout="divided"
        title="Fast, steady, and close to everyone"
        description="Measured across every region from October 2025 to September 2026."
      />
    </div>
  );
}
Dependencies
More by kuratlielia
View all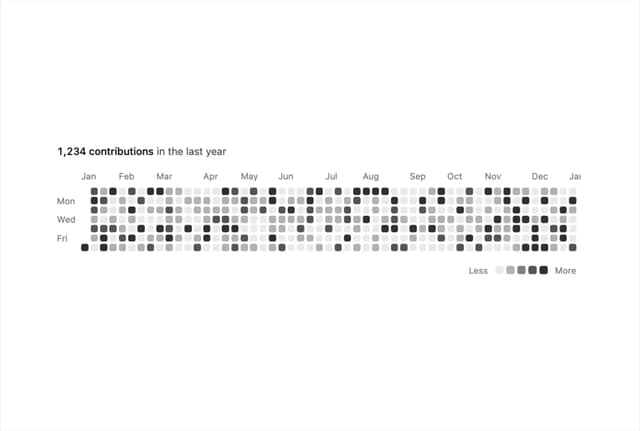
Activity Heatmap
511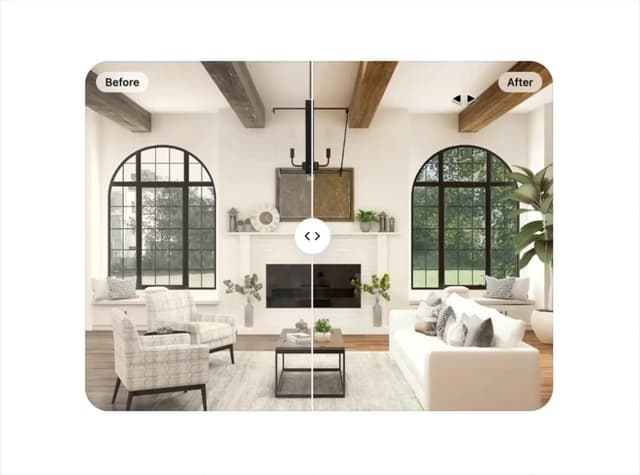
Image Compare
182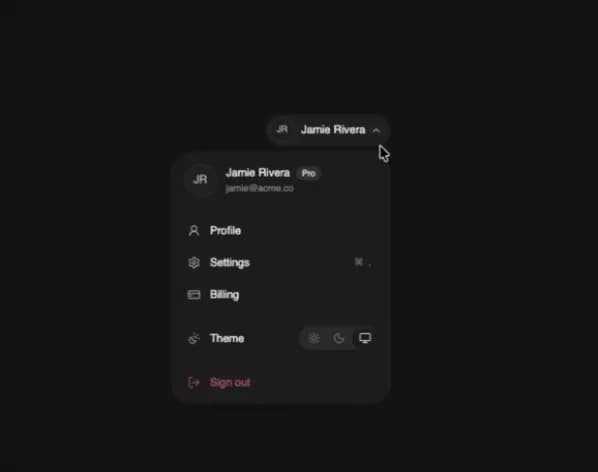
User Menu
112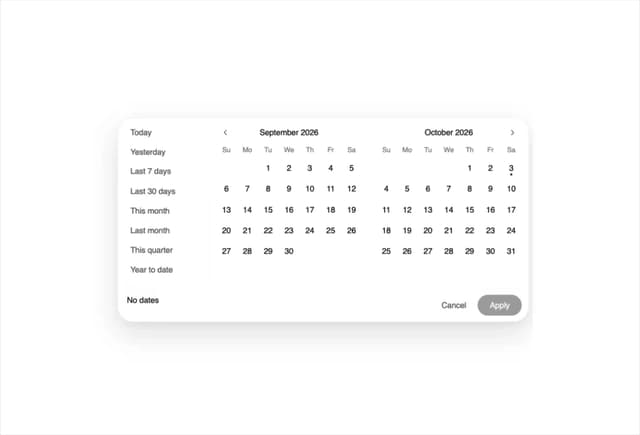
Date Range Picker
91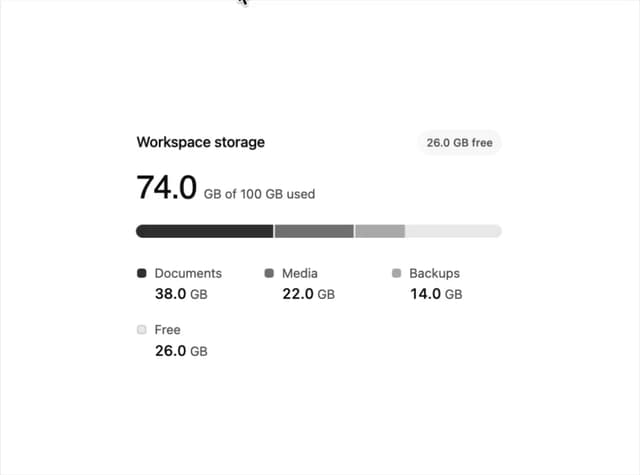
Usage Meter
72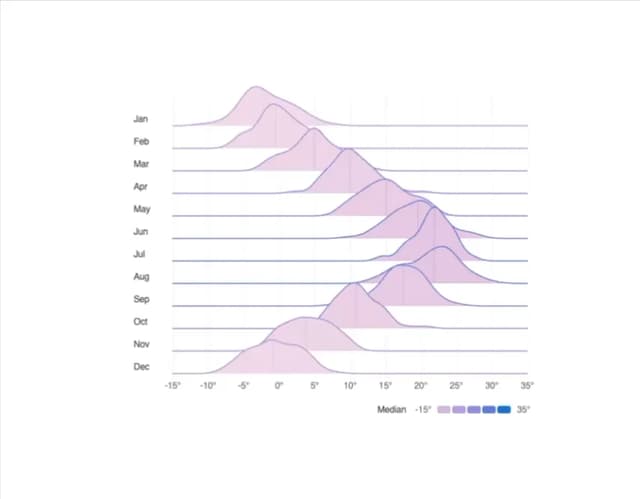
Ridgeline Chart
55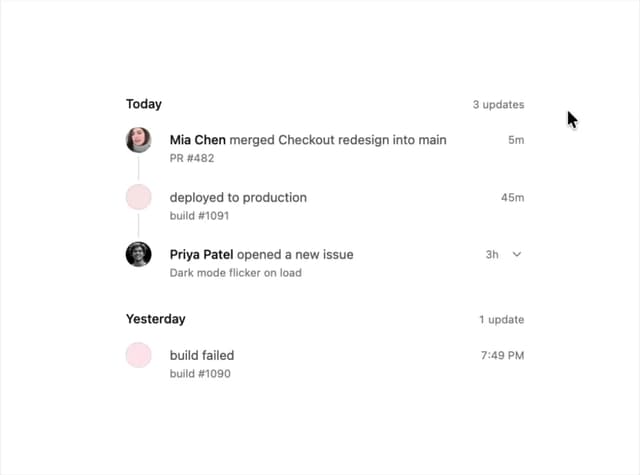
Timeline
55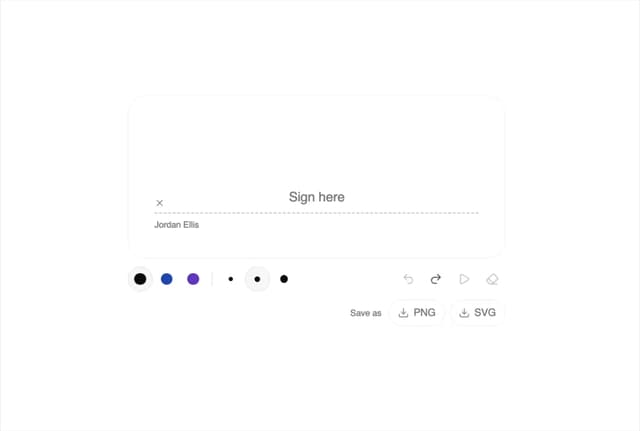
Signature Pad
49
More in Dashboards
View all
Dashboard with Collapsible Sidebar
2.6K
Stat Card
46

Sidebar
392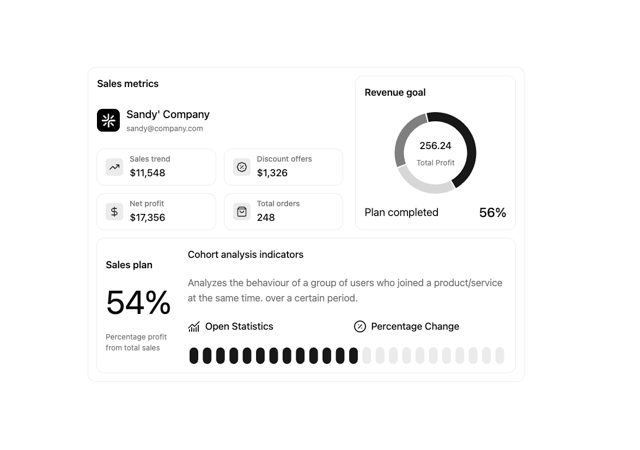

Chart Component
11

SaaS Template
2.7K

Fitness Bento Grid
42

Financial Bento Grid
129

Course Design Cards
1.3K

