
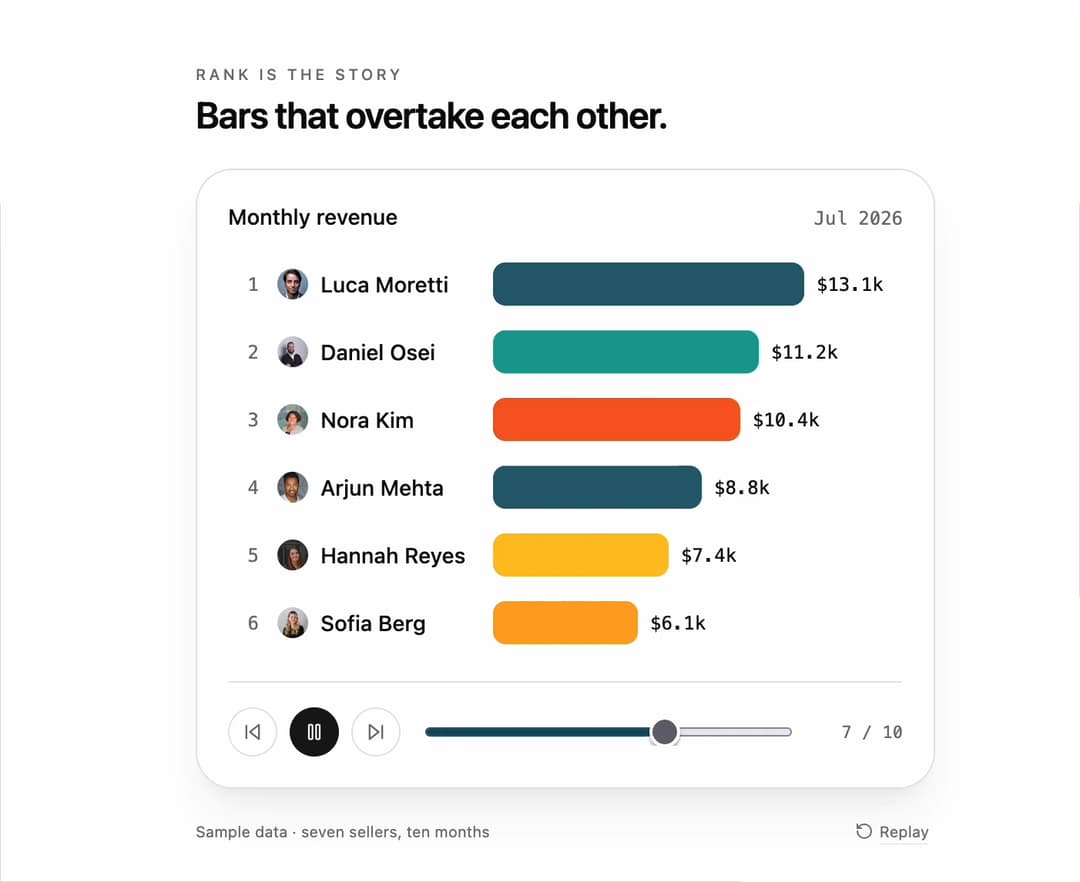
Bar race chart for React and Tailwind CSS (shadcn/ui) that re-sorts its ranked horizontal bars with motion whenever the data changes, so bars overtake each other instead of snapping into a new order. It is built for leaderboards, top-products widgets and period-over-period dashboards where rank is the story. A bar race chart is a ranked bar chart whose position, length and value label are all animated between data frames; this one uses FLIP translate animations with the Web Animations API, animates bar widths and rolls the numbers, shows small rank-change chips (up, down, new) that fade on their own, slides new entrants in from below the fold and fades displaced rows out. Colors come from the shadcn chart tokens, per row or auto-assigned. Supports topN, sort order, a fixed max scale, duration, row height, number formatting, caption and period labels, optional icons per row, reduced motion, and a visually hidden table for screen readers. The chart only reacts to its data prop; the included demo steps through ten months of sample data with play, pause and a scrubber and makes no requests. Requires React only, with no chart or animation library.
Built with React and Tailwind. Copy the prompt and paste it into Claude Code, Cursor or Lovable: your agent adds Bar Race Chart to your project and fits it to your theme.
Code
How Bar Race Chart is used: the demo's code. The component's own source comes with a free account.
Usage.tsx
"use client";

import * as React from "react";
import { Pause, Play, RotateCcw, SkipBack, SkipForward } from "lucide-react";
import { BarRaceChart } from "@/components/ui/bar-race-chart";
import type { BarRaceDatum } from "@/components/ui/bar-race-chart";

type DemoProps = { autoplay?: boolean; bare?: boolean; frame?: number; interval?: number };

const PHOTO = (id: string) => `https://images.unsplash.com/${id}?w=40&h=40&fit=crop&crop=faces&q=80&auto=format`;

const SELLERS = [
  { id: "nora", label: "Nora Kim", photo: PHOTO("photo-1573497019940-1c28c88b4f3e") },
  { id: "daniel", label: "Daniel Osei", photo: PHOTO("photo-1629425733761-caae3b5f2e50") },
  { id: "luca", label: "Luca Moretti", photo: PHOTO("photo-1500648767791-00dcc994a43e") },
  { id: "hannah", label: "Hannah Reyes", photo: PHOTO("photo-1543949806-2c9935e6aa78") },
  { id: "sofia", label: "Sofia Berg", photo: PHOTO("photo-1699899657680-421c2c2d5064") },
  { id: "mateus", label: "Mateus Silva", photo: PHOTO("photo-1705645930353-0e335311ef20") },
  { id: "arjun", label: "Arjun Mehta", photo: PHOTO("photo-1507003211169-0a1dd7228f2d") },
];

const PERIODS = ["Jan 2026", "Feb 2026", "Mar 2026", "Apr 2026", "May 2026", "Jun 2026", "Jul 2026", "Aug 2026", "Sep 2026", "Oct 2026"];

const VALUES: number[][] = [
  [8200, 7600, 5100, 4300, 3900, 2600, 1900],
  [8600, 9100, 5600, 4700, 4100, 2900, 2200],
  [9100, 9800, 6900, 5200, 4400, 3300, 2500],
  [9400, 10200, 8400, 5800, 4900, 3600, 4300],
  [9700, 10600, 9900, 6200, 5300, 3800, 5600],
  [10100, 10900, 11800, 6900, 5600, 4000, 7200],
  [10400, 11200, 13100, 7400, 6100, 4200, 8800],
  [10800, 11400, 14600, 7900, 6400, 4300, 10900],
  [11100, 11500, 15900, 8300, 6700, 4400, 12400],
  [11400, 11600, 17200, 8800, 7000, 4500, 13900],
];

const TONE = { nora: 1, daniel: 2, luca: 3, hannah: 4, sofia: 5, mateus: 1, arjun: 3 } as const;

const frameData = (index: number): BarRaceDatum[] =>
  SELLERS.map((seller, i) => ({
    id: seller.id,
    label: seller.label,
    value: VALUES[index]![i]!,
    color: TONE[seller.id as keyof typeof TONE],
    icon: <img src={seller.photo} alt="" loading="lazy" decoding="async" className="size-5 shrink-0 rounded-full object-cover" />,
  }));

const formatRevenue = (value: number) => `$${(value / 1000).toFixed(1)}k`;

export default function BarRaceChartDemo({ autoplay = true, bare = false, frame: initialFrame = 0, interval = 700 }: DemoProps) {
  const [frame, setFrame] = React.useState(Math.min(VALUES.length - 1, Math.max(0, initialFrame)));
  const [playing, setPlaying] = React.useState(autoplay);
  const [motion, setMotion] = React.useState({ ready: false, reduced: true });
  const [run, setRun] = React.useState(0);

  React.useEffect(() => {
    const media = window.matchMedia("(prefers-reduced-motion: reduce)");
    const update = () => setMotion({ ready: true, reduced: media.matches });
    update();
    media.addEventListener("change", update);
    return () => media.removeEventListener("change", update);
  }, []);

  React.useEffect(() => {
    if (!motion.ready || !playing || motion.reduced) return;
    const timers: number[] = [];
    for (let step = 1; step < VALUES.length; step += 1) timers.push(window.setTimeout(() => setFrame(step), 500 + (step - 1) * interval));
    timers.push(window.setTimeout(() => setFrame(0), 500 + (VALUES.length - 1) * interval + 1800));
    timers.push(window.setTimeout(() => setRun((previous) => previous + 1), 500 + (VALUES.length - 1) * interval + 2600));
    return () => timers.forEach((timer) => window.clearTimeout(timer));
  }, [motion.ready, motion.reduced, playing, interval, run]);

  const step = (delta: number) => { setPlaying(false); setFrame((previous) => Math.min(VALUES.length - 1, Math.max(0, previous + delta))); };

  return (
    <main className="flex min-h-svh w-full flex-col items-center justify-center gap-5 bg-background px-5 py-6 text-foreground">
      {!bare && (
        <header className="w-full max-w-[480px]">
          <p className="mb-1 text-[10px] font-medium uppercase tracking-[0.2em] text-muted-foreground">Rank is the story</p>
          <h1 className="text-[24px] font-semibold leading-tight tracking-tight">Bars that overtake each other.</h1>
        </header>
      )}
      <section className="w-full max-w-[480px] rounded-3xl border border-border bg-card p-5 shadow-xl shadow-primary/5">
        <BarRaceChart data={frameData(frame)} topN={6} duration={Math.max(200, interval - 100)} caption="Monthly revenue" period={PERIODS[frame]} formatValue={formatRevenue} />
        <div className="mt-4 flex items-center gap-2 border-t border-border pt-4">
          <button type="button" data-prev aria-label="Previous month" onClick={() => step(-1)} disabled={frame === 0} className="inline-flex size-8 items-center justify-center rounded-full border border-border text-muted-foreground outline-none transition-colors hover:text-foreground focus-visible:ring-2 focus-visible:ring-ring disabled:opacity-40"><SkipBack className="size-3.5" aria-hidden="true" /></button>
          <button type="button" data-play aria-label={playing ? "Pause" : "Play"} aria-pressed={playing} onClick={() => setPlaying((previous) => !previous)} className="inline-flex size-8 items-center justify-center rounded-full bg-primary text-primary-foreground outline-none focus-visible:ring-2 focus-visible:ring-ring focus-visible:ring-offset-2 focus-visible:ring-offset-card">{playing ? <Pause className="size-3.5" aria-hidden="true" /> : <Play className="size-3.5" aria-hidden="true" />}</button>
          <button type="button" data-next aria-label="Next month" onClick={() => step(1)} disabled={frame === VALUES.length - 1} className="inline-flex size-8 items-center justify-center rounded-full border border-border text-muted-foreground outline-none transition-colors hover:text-foreground focus-visible:ring-2 focus-visible:ring-ring disabled:opacity-40"><SkipForward className="size-3.5" aria-hidden="true" /></button>
          <input type="range" data-scrub aria-label="Month" min={0} max={VALUES.length - 1} value={frame} onChange={(event) => { setPlaying(false); setFrame(Number(event.target.value)); }} className="ml-2 h-1.5 min-w-0 flex-1 cursor-pointer accent-chart-3" />
          <span data-frame className="w-16 text-right font-mono text-[11px] tabular-nums text-muted-foreground">{frame + 1} / {VALUES.length}</span>
        </div>
      </section>
      {!bare && (
        <footer className="flex w-full max-w-[480px] items-center justify-between text-[10px] text-muted-foreground">
          <span>Sample data · seven sellers, ten months</span>
          <button type="button" data-replay onClick={() => { setFrame(0); setPlaying(true); setRun((previous) => previous + 1); }} className="inline-flex items-center gap-1 rounded px-1 underline decoration-border underline-offset-4 hover:text-foreground focus-visible:outline-none focus-visible:ring-2 focus-visible:ring-ring"><RotateCcw className="size-3" aria-hidden="true" />Replay</button>
        </footer>
      )}
    </main>
  );
}
More by DHxWhy
View all

Product Rail Gallery – Fashion Store Hero Section
3.1K
Sushi Conveyor Belt Menu – Restaurant Hero Section
1.4K
Team Lanyard Rail – Meet the Team Section with Flip Badges
1.4K
Skateboard Deck Rail Gallery – Skate Shop Hero Section
738
Picture Rail Image Gallery – Art Print Shop Hero Section
535
Sun Moon Dark Mode Theme Toggle
407
World Testimonials Globe – Social Proof Hero Section
387
Pendant Lamp Rail Gallery – Lighting Store Hero Section
350
More in Dashboards
View all
Dashboard with Collapsible Sidebar
2.6K
Stat Card
46

Sidebar
392

Chart Component
11

SaaS Template
2.7K

Fitness Bento Grid
42

Financial Bento Grid
129

Course Design Cards
1.3K

