
About
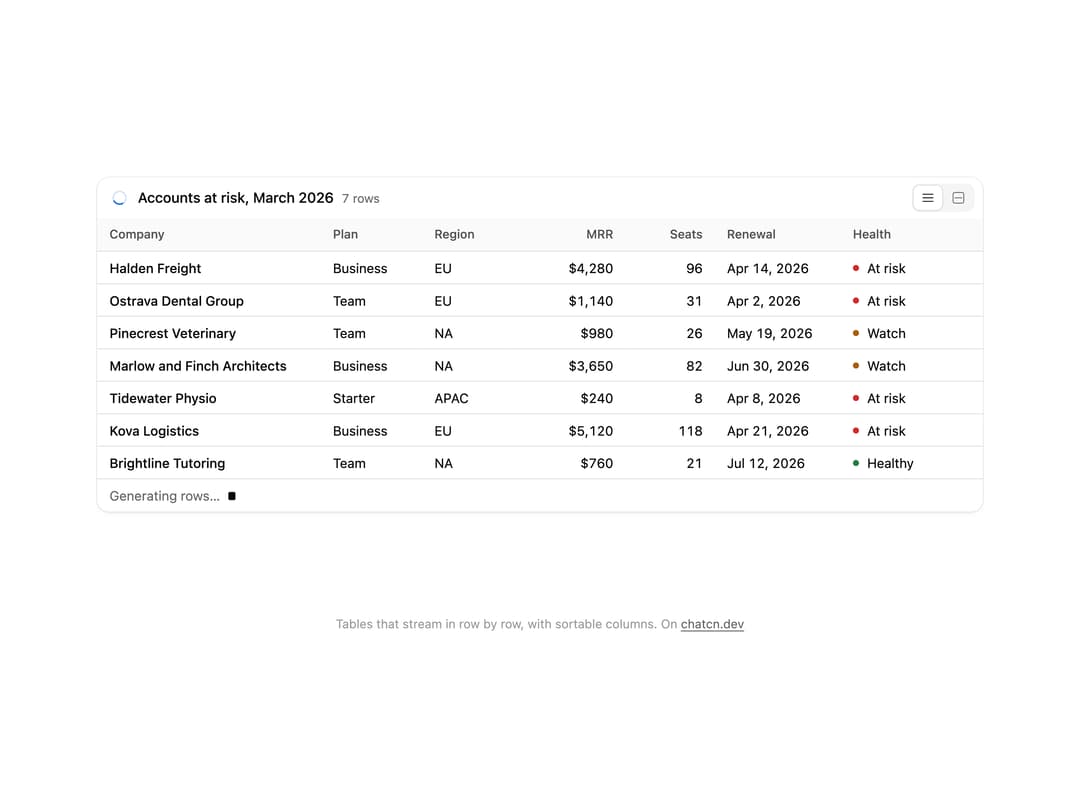
A data table that streams rows in as an agent writes them, with typed columns, status badges and sortable headers.
Built with React and Tailwind. Copy the prompt and paste it into Claude Code, Cursor or Lovable: your agent adds Data Table to your project and fits it to your theme.
Code
How Data Table is used: the demo's code. The component's own source comes with a free account.
Usage.tsx
"use client"

import * as React from "react"
import { DataTable, DataTableColumn, DataTableSort } from "@/components/ui/data-table"

/** How long a choice holds a tour before it carries on. */
const RESUME_MS = 1800

/** True until `RESUME_MS` after the last `hold()`, for tours with their own state. */
function useHold() {
  const [held, setHeld] = React.useState(false)
  const timer = React.useRef(0)
  React.useEffect(() => () => window.clearTimeout(timer.current), [])
  const hold = React.useCallback(() => {
    setHeld(true)
    window.clearTimeout(timer.current)
    timer.current = window.setTimeout(() => setHeld(false), RESUME_MS)
  }, [])
  return [held, hold] as const
}

/** Accounts the churn analysis flagged, as the agent returned them for March 2026. */
interface AtRiskAccount extends Record<string, unknown> {
  id: string
  company: string
  plan: "Starter" | "Team" | "Business"
  region: "EU" | "NA" | "APAC"
  mrr: number
  seats: number
  seatChange: number | null
  renewal: string
  health: "at-risk" | "watch" | "healthy" | "onboarding"
  lastLogin: string | null
}

const accounts: AtRiskAccount[] = [
  ["Halden Freight", "Business", "EU", 4280, 96, -0.22, "2026-04-14", "at-risk", "2026-02-27"],
  ["Ostrava Dental Group", "Team", "EU", 1140, 31, -0.18, "2026-04-02", "at-risk", "2026-03-04"],
  ["Pinecrest Veterinary", "Team", "NA", 980, 26, -0.12, "2026-05-19", "watch", "2026-03-21"],
  [
    "Marlow and Finch Architects",
    "Business",
    "NA",
    3650,
    82,
    -0.09,
    "2026-06-30",
    "watch",
    "2026-03-24",
  ],
  ["Tidewater Physio", "Starter", "APAC", 240, 8, null, "2026-04-08", "at-risk", null],
  ["Kova Logistics", "Business", "EU", 5120, 118, -0.31, "2026-04-21", "at-risk", "2026-02-11"],
  ["Brightline Tutoring", "Team", "NA", 760, 21, 0.05, "2026-07-12", "healthy", "2026-03-28"],
  ["Sandoval Family Law", "Starter", "NA", 180, 6, -0.33, "2026-04-03", "at-risk", "2026-01-30"],
  ["Ember Street Clinic", "Team", "APAC", 1320, 36, -0.06, "2026-05-02", "watch", "2026-03-18"],
  [
    "Arlo Property Management",
    "Business",
    "EU",
    2890,
    64,
    0,
    "2026-08-15",
    "healthy",
    "2026-03-27",
  ],
  ["Quarry Hill Schools", "Business", "NA", 6400, 160, -0.14, "2026-04-30", "watch", "2026-03-12"],
  ["Lindqvist Optics", "Team", "EU", 690, 18, -0.28, "2026-04-11", "at-risk", "2026-02-19"],
  ["Rowan Dermatology", "Team", "NA", 1050, 28, 0.08, "2026-09-01", "onboarding", "2026-03-29"],
  ["Copperleaf Salons", "Starter", "APAC", 320, 11, -0.19, "2026-04-17", "at-risk", null],
  ["Harbor Point Marinas", "Team", "NA", 870, 23, -0.04, "2026-06-06", "watch", "2026-03-25"],
  ["Fennimore Accounting", "Business", "EU", 3180, 71, -0.11, "2026-05-27", "watch", "2026-03-20"],
  ["Elmhurst Pediatrics", "Team", "NA", 1210, 33, 0.12, "2026-10-14", "healthy", "2026-03-30"],
  ["Calloway Fitness", "Starter", "EU", 210, 7, -0.42, "2026-04-05", "at-risk", "2026-01-22"],
  ["Westbrook Auto Care", "Team", "NA", 640, 17, -0.15, "2026-04-26", "at-risk", "2026-03-02"],
  ["Saltmarsh Coworking", "Team", "EU", 930, 25, 0.02, "2026-07-03", "onboarding", "2026-03-31"],
  ["Aldine Music School", "Starter", "APAC", 150, 5, null, "2026-05-09", "watch", "2026-03-15"],
  ["Vela Chiropractic", "Team", "APAC", 720, 19, -0.21, "2026-04-19", "at-risk", "2026-02-24"],
  [
    "Greyhawk Security Services",
    "Business",
    "NA",
    4710,
    104,
    -0.07,
    "2026-06-18",
    "watch",
    "2026-03-26",
  ],
  [
    "Moraine Physical Therapy",
    "Team",
    "EU",
    1080,
    29,
    -0.24,
    "2026-04-23",
    "at-risk",
    "2026-03-06",
  ],
].map(([company, plan, region, mrr, seats, seatChange, renewal, health, lastLogin], i) => ({
  id: `acc_${String(i + 1).padStart(3, "0")}`,
  company: company as string,
  plan: plan as AtRiskAccount["plan"],
  region: region as AtRiskAccount["region"],
  mrr: mrr as number,
  seats: seats as number,
  seatChange: seatChange as number | null,
  renewal: renewal as string,
  health: health as AtRiskAccount["health"],
  lastLogin: lastLogin as string | null,
}))

/** As many rows as the frame shows, so every one is seen arriving. */
const rows = accounts.slice(0, 10)

const reducedMotion = () => window.matchMedia("(prefers-reduced-motion: reduce)").matches

/** After the rows land, the table sorts itself the way an analyst would read it. */
const SORTS: (DataTableSort | null)[] = [
  null,
  { columnId: "mrr", direction: "desc" },
  { columnId: "renewal", direction: "asc" },
]

const FIRST_ROW_MS = 900

const ROW_MS = 240

const SORT_MS = 2000

const FIT_CSS = "html,body{overflow:hidden}[data-fit-small] [data-fit-hide]{display:none!important}"

/**
 * 21st shows a demo in a small frame: about 674 by 421 on a component page, 358 by 224 on a
 * phone and 245 by 139 on a profile card. A demo taller than its frame gets scrollbars, which
 * render white on dark pages. FitFrame fills the frame exactly instead.
 *
 * - "scale": the content shrinks until it fits, centered. For visuals such as orbs.
 * - "crop": the content stays at full size from the top and fades out at the bottom. For text
 *   that streams in, where a changing scale would make the page breathe.
 *
 * `minWidth` lays out a wide demo (a table, a two column panel) at that width and scales it down
 * to the frame, instead of letting it collapse to a narrow layout. The frame centers it, so it
 * shrinks evenly on both sides.
 *
 * Anything marked `data-fit-hide` (state buttons, the chatcn.dev line) drops out in frames
 * shorter than `hideBelow`, so a profile card shows the visual alone.
 */
function FitFrame({
  children,
  mode = "scale",
  hideBelow = 360,
  minWidth,
}: {
  children: React.ReactNode
  mode?: "scale" | "crop"
  hideBelow?: number
  minWidth?: string
}) {
  const content = React.useRef<HTMLDivElement>(null)
  const [cropped, setCropped] = React.useState(false)

  React.useLayoutEffect(() => {
    const el = content.current
    if (!el) return
    const measure = () => {
      const vw = window.innerWidth
      const vh = window.innerHeight
      el.toggleAttribute("data-fit-small", vh < hideBelow)
      // Layout sizes ignore the transform, so measuring never feeds back.
      const w = Math.max(el.offsetWidth, el.scrollWidth)
      const h = Math.max(el.offsetHeight, el.scrollHeight)
      const scale = mode === "scale" ? Math.min(1, vw / w, vh / h) : 1
      el.style.transform = scale < 1 ? `scale(${scale})` : ""
      setCropped(mode === "crop" && h > vh + 1)
    }
    measure()
    const observer = new ResizeObserver(measure)
    observer.observe(el)
    // Content that changes inside a fixed width box (a headline that cycles words) never resizes
    // the box itself, so changes below it measure again on the next frame.
    let frame = 0
    const mutations = new MutationObserver(() => {
      cancelAnimationFrame(frame)
      frame = requestAnimationFrame(measure)
    })
    mutations.observe(el, { subtree: true, childList: true, characterData: true })
    window.addEventListener("resize", measure)
    return () => {
      observer.disconnect()
      mutations.disconnect()
      cancelAnimationFrame(frame)
      window.removeEventListener("resize", measure)
    }
  }, [mode, hideBelow])

  const fade = "linear-gradient(to bottom, #000 calc(100% - 40px), transparent)"
  return (
    <div
      className="flex w-full justify-center overflow-hidden"
      style={{
        height: "100dvh",
        alignItems: mode === "crop" ? "flex-start" : "center",
        maskImage: cropped ? fade : undefined,
        WebkitMaskImage: cropped ? fade : undefined,
      }}
    >
      <style>{FIT_CSS}</style>
      <div
        ref={content}
        className="w-full shrink-0"
        style={{ transformOrigin: mode === "crop" ? "top center" : "center", minWidth }}
      >
        {children}
      </div>
    </div>
  )
}

/** The columns that fit the preview: who, what they pay, when they renew and how they are doing. */
const KEEP = ["company", "plan", "region", "mrr", "seats", "renewal", "health"]

const healthStatuses = {
  "at-risk": { label: "At risk", tone: "red" },
  watch: { label: "Watch", tone: "amber" },
  onboarding: { label: "Onboarding", tone: "blue" },
  healthy: { label: "Healthy", tone: "green" },
} as const

const accountColumns: DataTableColumn<AtRiskAccount>[] = [
  { id: "company", header: "Company", width: 220 },
  { id: "plan", header: "Plan", width: 100 },
  { id: "region", header: "Region", width: 88 },
  { id: "mrr", header: "MRR", type: "currency", width: 112 },
  { id: "seats", header: "Seats", type: "number", width: 88 },
  { id: "seatChange", header: "Seat change", type: "percent", signed: true, width: 116 },
  { id: "renewal", header: "Renewal", type: "date", width: 124 },
  { id: "health", header: "Health", type: "status", statuses: healthStatuses, width: 128 },
  { id: "lastLogin", header: "Last admin login", type: "date", width: 148 },
]

const columns = KEEP.map((id) => accountColumns.find((c) => c.id === id)!)

/** The line under each 21st demo that points back to the kit. */
function MoreOn({ slug, children }: { slug: string; children: React.ReactNode }) {
  return (
    <p data-fit-hide className="text-[0.75rem]/[1rem] text-(color:--chatcn-fg-faint) text-center text-balance">
      {children}{" "}
      <a
        href={`https://chatcn.dev/docs/components/${slug}`}
        target="_blank"
        rel="noopener"
        className="text-(color:--chatcn-fg-subtle) hover:text-(color:--chatcn-fg) underline underline-offset-2"
      >
        chatcn.dev
      </a>
    </p>
  )
}

/**
 * An analytics agent returns the accounts at risk of churning. Rows stream in one at a time,
 * then the table sorts by revenue, then by renewal date, and the stream replays. Sort a column
 * yourself and the tour waits a moment.
 */
export default function DataTablePreview() {
  const [count, setCount] = React.useState(0)
  const [sortStep, setSortStep] = React.useState(0)
  const [held, hold] = useHold()
  const [picked, setPicked] = React.useState<DataTableSort | null>(null)
  const streaming = count < rows.length

  React.useEffect(() => {
    if (reducedMotion()) {
      setCount(rows.length)
      return
    }
    if (held) return
    const id = window.setTimeout(
      () => {
        setPicked(null)
        if (streaming) return setCount((n) => n + 1)
        if (sortStep < SORTS.length - 1) return setSortStep((s) => s + 1)
        setSortStep(0)
        setCount(0)
      },
      streaming ? (count === 0 ? FIRST_ROW_MS : ROW_MS) : SORT_MS,
    )
    return () => window.clearTimeout(id)
  }, [count, streaming, sortStep, held])

  return (
    <FitFrame minWidth="58rem">
      <div className="flex w-full flex-col items-center justify-center gap-4 p-6">
        <div className="flex h-[26rem] w-full items-start justify-center">
          <DataTable
            className="w-full max-w-[54.5rem]"
            title="Accounts at risk, March 2026"
            columns={columns}
            rows={rows.slice(0, count)}
            streaming={streaming}
            sort={picked ?? SORTS[sortStep]}
            onSortChange={(next) => {
              hold()
              setPicked(next)
            }}
            maxHeight={360}
          />
        </div>
        <MoreOn slug="data-table">Tables that stream in row by row, with sortable columns. On</MoreOn>
      </div>
    </FitFrame>
  )
}
Dependencies
More by Aadi
View all
Stat Card
46
Audio Visualizer
32
Dither Orb
24
Voice Orb
20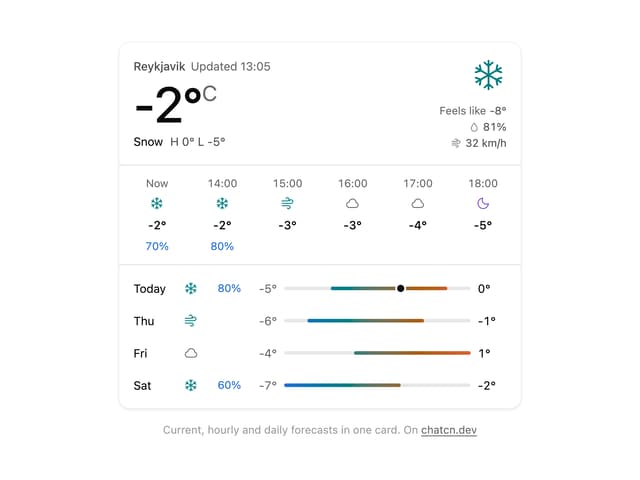
Weather Card
17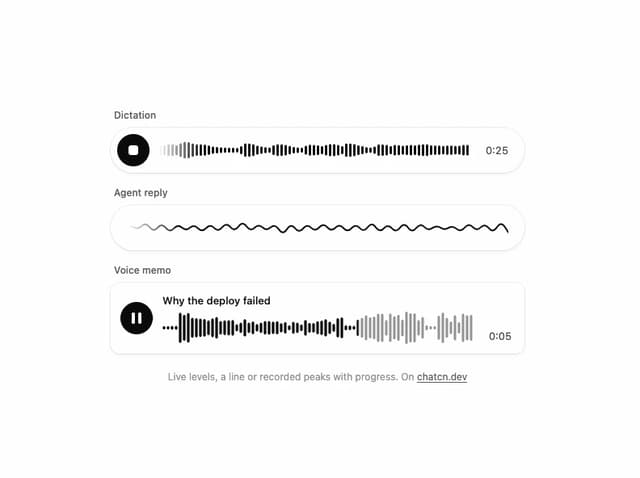
Waveform
15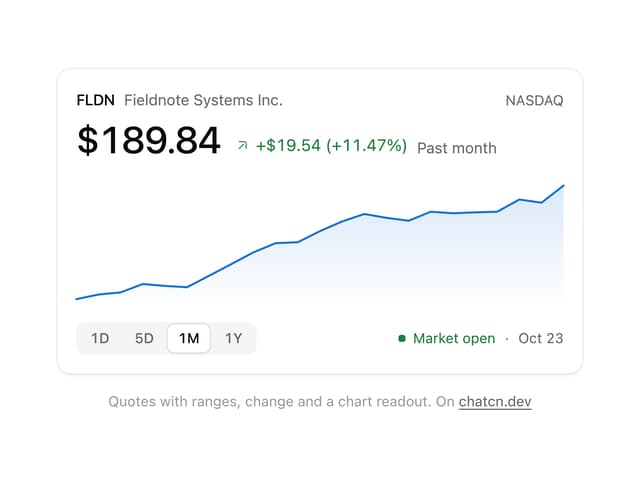
Ticker Card
15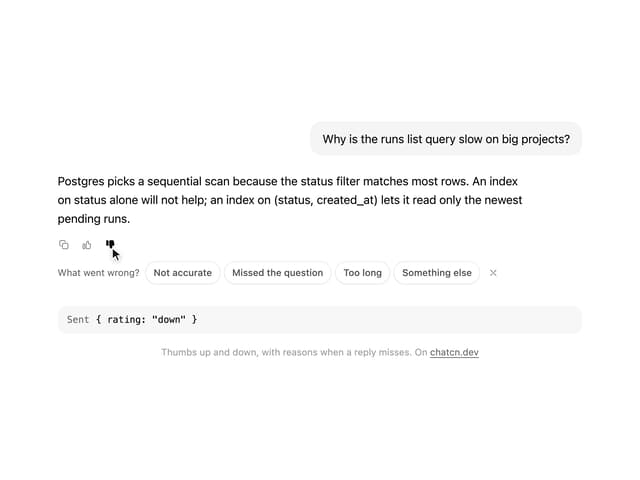
Message Feedback
13
More in AI chats
View all

AI Actions
351

Aquarium Prompt
113
Agent Chat
21

Message With Header And Delivery Status
60
Research Report
7
Tool Web Fetch
4
Color Picker
201
Suggestions
40

