
About
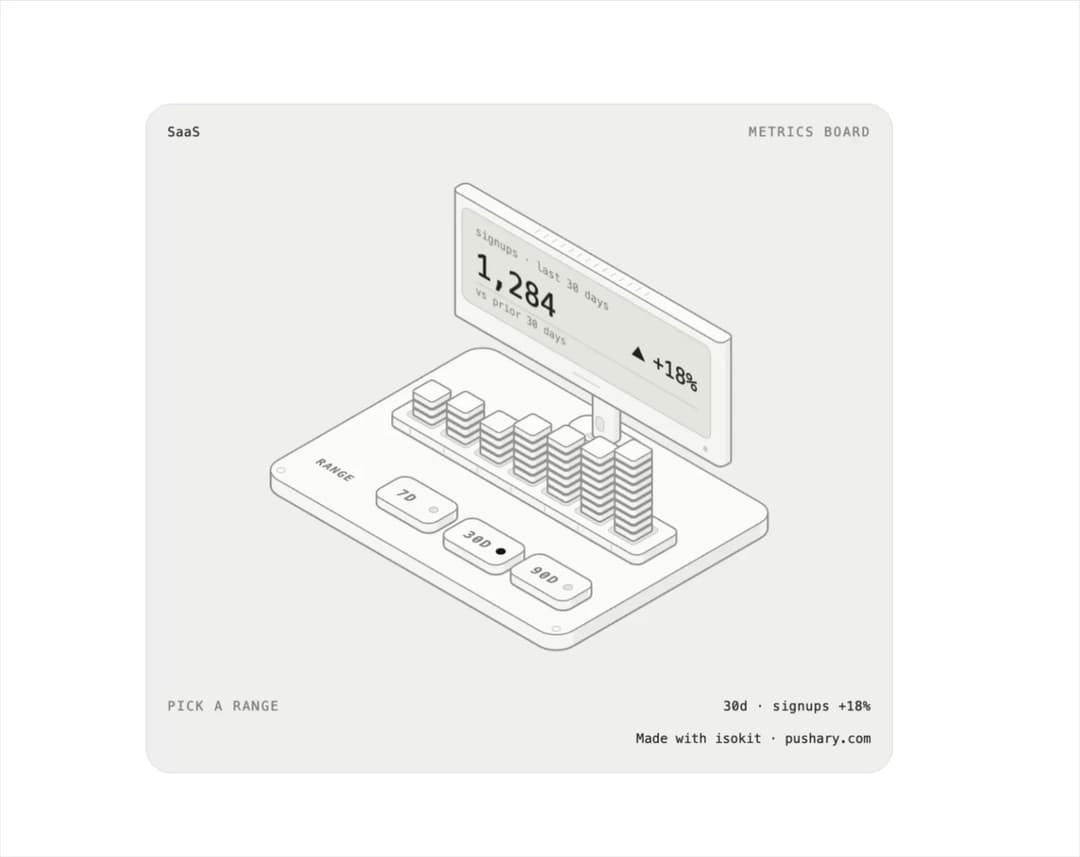
An interactive isometric desk-monitor illustration that rebuilds its bar chart and rolls over a signups total when you press a 7D/30D/90D range key.
Built with React and Tailwind. Copy the prompt and paste it into Claude Code, Cursor or Lovable: your agent adds Metrics Board to your project and fits it to your theme.
Code
How Metrics Board is used: the demo's code. The component's own source comes with a free account.
Usage.tsx
import MetricsBoard from "@/components/ui/metrics-board";

export default function MetricsBoardDemo() {
  return (
    <div className="flex min-h-screen w-full items-center justify-center p-8">
      <div className="w-full max-w-xl">
        <MetricsBoard />
      </div>
    </div>
  );
}
Dependencies
More by aadilghani1
View all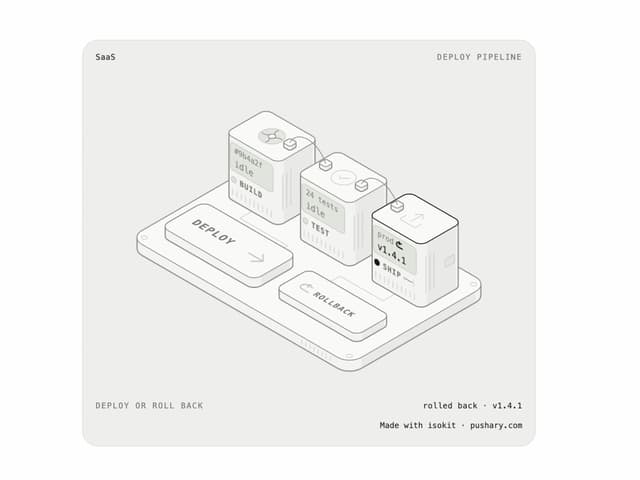
Deploy Pipeline
110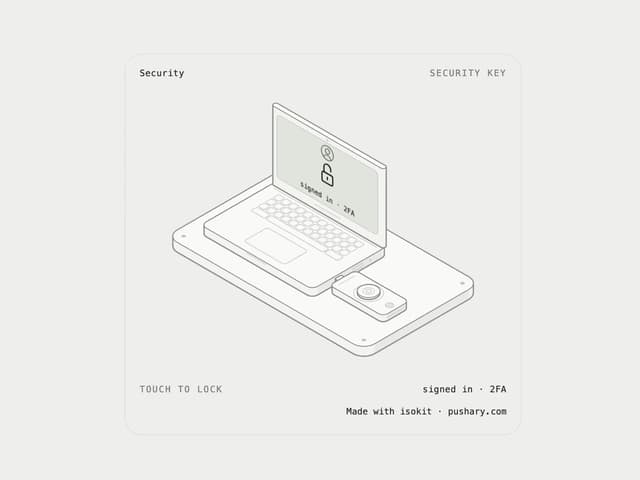
Security Key
103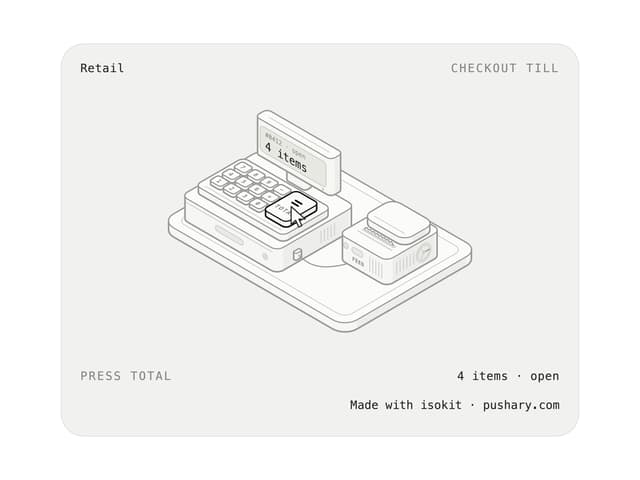
Checkout Till
87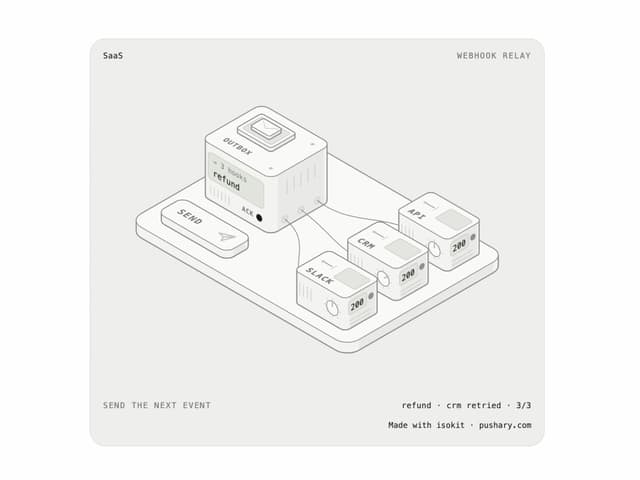
Webhook Relay
61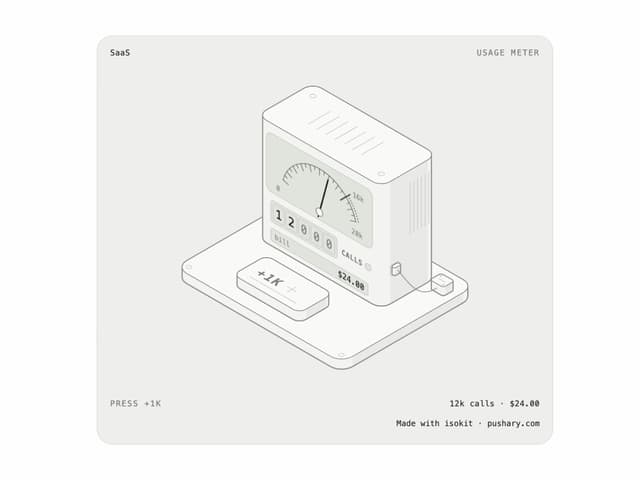
Usage Meter
49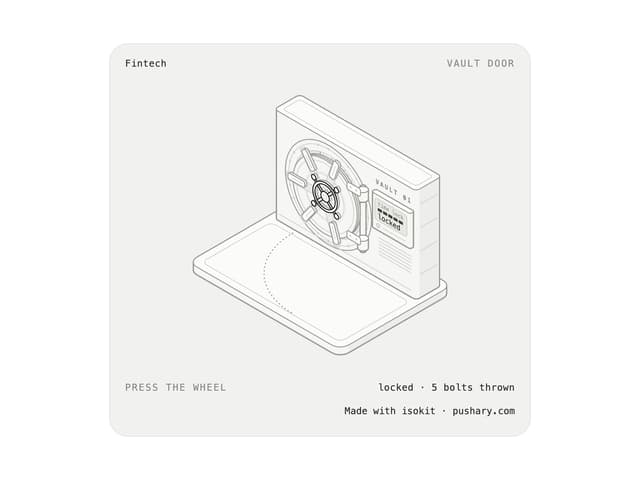
Vault Door
44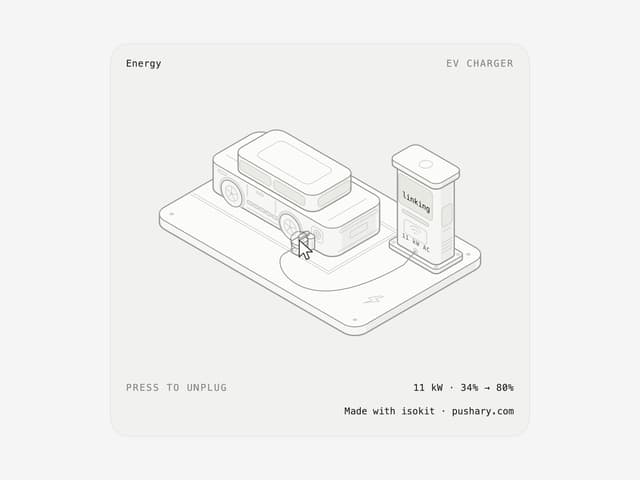
EV Charger
37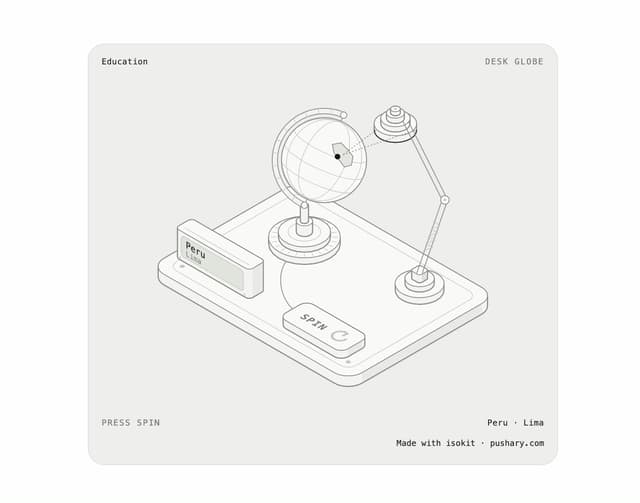
Desk Globe
37
More in Dashboards
View all
Dashboard with Collapsible Sidebar
2.6K
Stat Card
46

Sidebar
392

Chart Component
11

SaaS Template
2.7K

Fitness Bento Grid
42

Financial Bento Grid
129

Course Design Cards
1.3K

