About
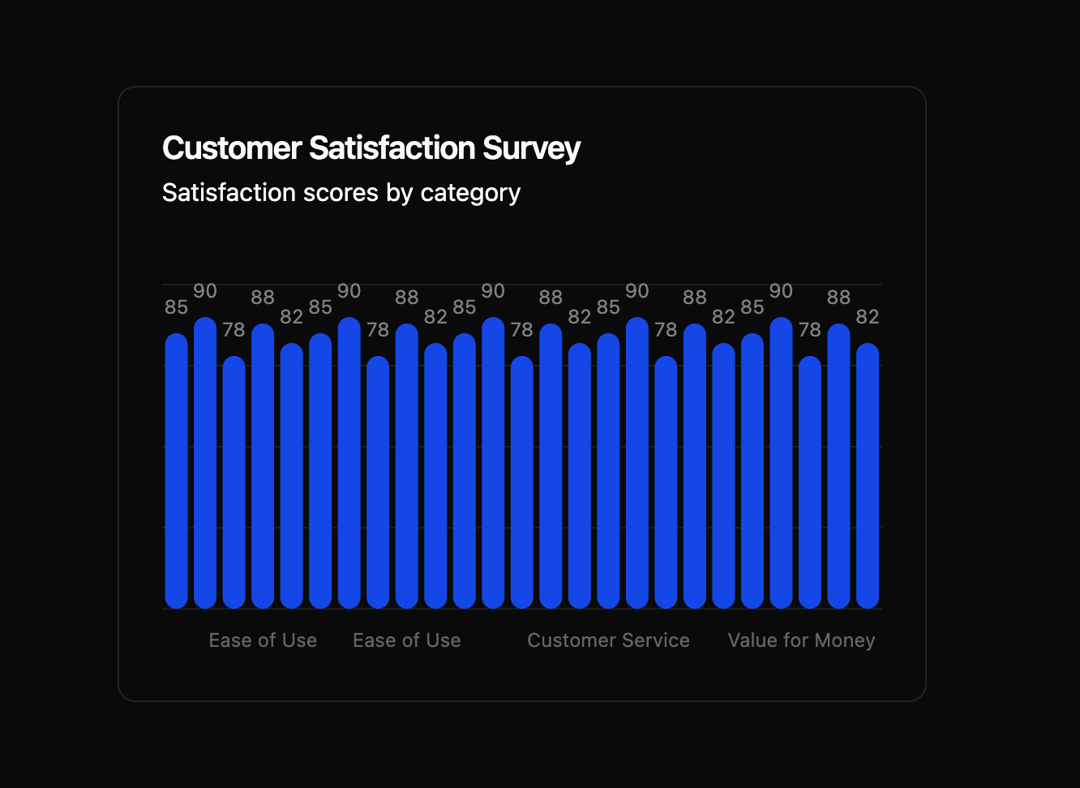
Here is Bar Chart component
Built with React and Tailwind. Copy the prompt and paste it into Claude Code, Cursor or Lovable: your agent adds Bar Chart to your project and fits it to your theme.
Code
How Bar Chart is used: the demo's code. The component's own source comes with a free account.
Usage.tsx
"use client"

import { Card } from "@/components/ui/card"
import { Chart, type ChartConfig, ChartTooltip, ChartTooltipContent } from "@/components/ui/bar-chart"
import { Bar, BarChart, CartesianGrid, LabelList, XAxis } from "recharts"

const surveyData = [
  { category: "Customer Support", satisfaction: 85 },
  { category: "Product Quality", satisfaction: 90 },
  { category: "Delivery Speed", satisfaction: 78 },
  { category: "Ease of Use", satisfaction: 88 },
  { category: "Value for Money", satisfaction: 82 },
  { category: "Customer Service", satisfaction: 85 },
  { category: "Product Quality", satisfaction: 90 },
  { category: "Delivery Speed", satisfaction: 78 },
  { category: "Ease of Use", satisfaction: 88 },
  { category: "Value for Money", satisfaction: 82 },
  { category: "Customer Service", satisfaction: 85 },
  { category: "Product Quality", satisfaction: 90 },
  { category: "Delivery Speed", satisfaction: 78 },
  { category: "Ease of Use", satisfaction: 88 },
  { category: "Value for Money", satisfaction: 82 },
  { category: "Customer Service", satisfaction: 85 },
  { category: "Product Quality", satisfaction: 90 },
  { category: "Delivery Speed", satisfaction: 78 },
  { category: "Ease of Use", satisfaction: 88 },
  { category: "Value for Money", satisfaction: 82 },
  { category: "Customer Service", satisfaction: 85 },
  { category: "Product Quality", satisfaction: 90 },
  { category: "Delivery Speed", satisfaction: 78 },
  { category: "Ease of Use", satisfaction: 88 },
  { category: "Value for Money", satisfaction: 82 },
]

const chartConfig = {
  satisfaction: {
    label: "Satisfaction",
    color: "var(--chart-1)",
  },
} satisfies ChartConfig

export default function Component() {
  return (
    <Card>
      <Card.Header
        title="Customer Satisfaction Survey"
        description="Satisfaction scores by category"
      />
      <Card.Content>
        <Chart className="h-[250px] w-full" config={chartConfig}>
          <BarChart
            accessibilityLayer
            data={surveyData}
            margin={{
              top: 20,
            }}
          >
            <CartesianGrid vertical={false} />
            <XAxis dataKey="category" tickLine={false} tickMargin={10} axisLine={false} />
            <ChartTooltip cursor={false} content={<ChartTooltipContent hideLabel />} />
            <Bar dataKey="satisfaction" fill="var(--color-satisfaction)" radius={8}>
              <LabelList position="top" offset={12} className="fill-fg" fontSize={12} />
            </Bar>
          </BarChart>
        </Chart>
      </Card.Content>
    </Card>
  )
}
Dependencies
More by Intent UI
View all

Radar Chart
237
Radial Chart
86
Pie Chart
37
Toggle Group
31
Loader
27
Progress Bar
23
Color Slider
15
Disclosure Group
13
More in Cards
View all

Course Design Cards
1.3K

Statistics Card 7
327
Statistics Card 2
305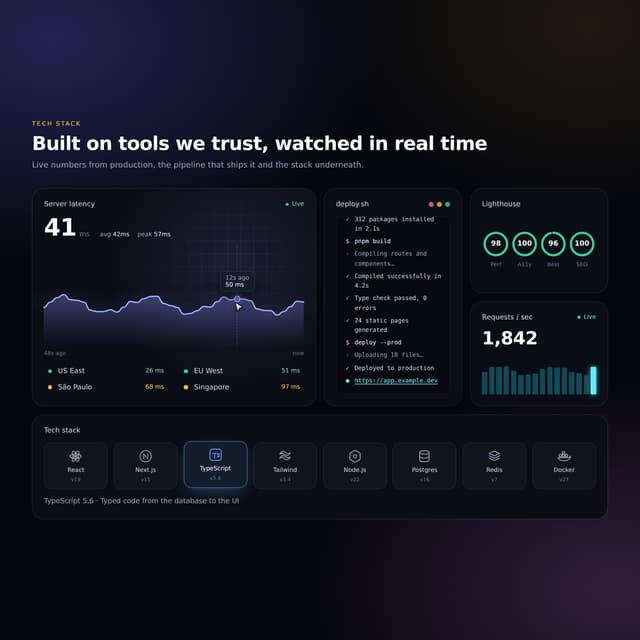

Interactive Tech Stack Bento Grid with Hover Effects
625

Card Studio
5
The Item one
4

Weather Card
65

Card
9