About
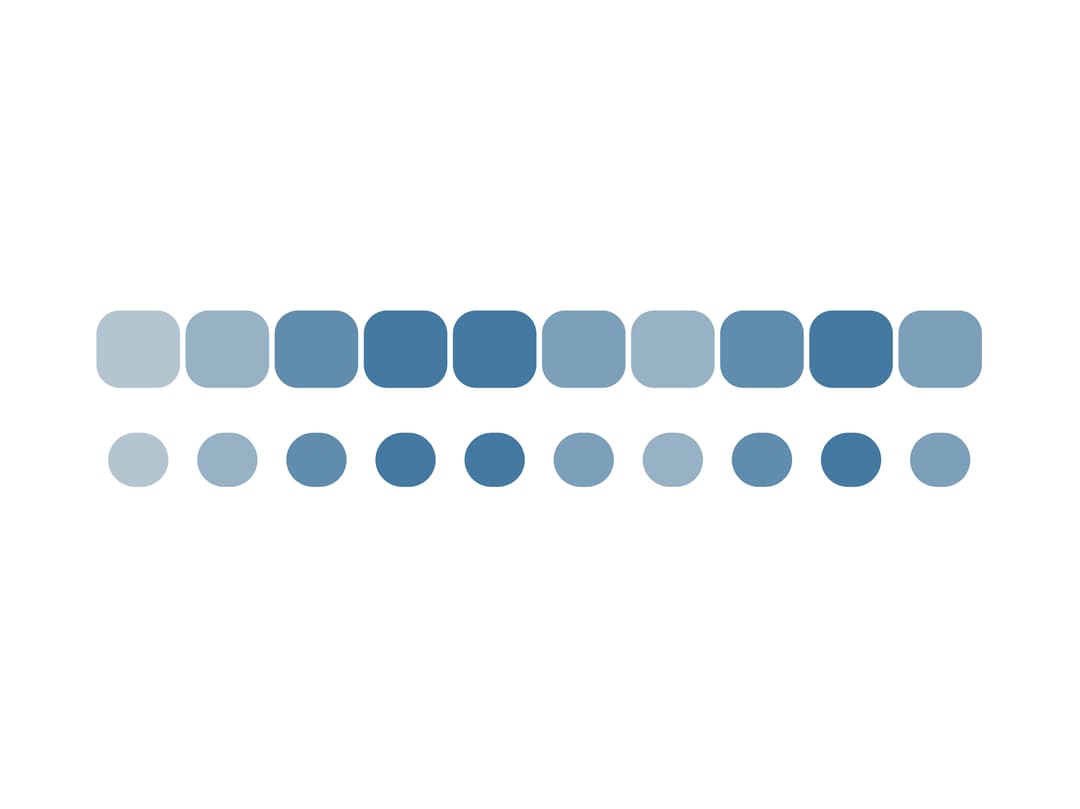
A compact single-row chart that colors each time step with a calibrated intensity cell, for showing load or activity levels across a timeline at a glance.
Built with React and Tailwind. Copy the prompt and paste it into Claude Code, Cursor or Lovable: your agent adds Heat Strip to your project and fits it to your theme.
Code
How Heat Strip is used: the demo's code. The component's own source comes with a free account.
Usage.tsx
import HeatStrip from "@/components/ui/heat-strip";

export default function HeatStripShapesDemo() {
  const load = [12, 38, 66, 88, 84, 55, 28, 62, 85, 58];

  return (
    <div className="flex items-center justify-center w-full h-full p-8">
      <span className="inline-flex flex-col gap-1.5">
        <HeatStrip
          data={load}
          domain={[0, 100]}
          shape="round"
          title="Round"
          width={160}
          height={14}
        />
        <HeatStrip
          data={load}
          domain={[0, 100]}
          shape="dot"
          title="Dot"
          width={160}
          height={14}
        />
      </span>
    </div>
  );
}
Dependencies
More by ganapativs
View all

SparkBar
Delta Indicator
Dumbbell Chart
Calendar Strip