
About
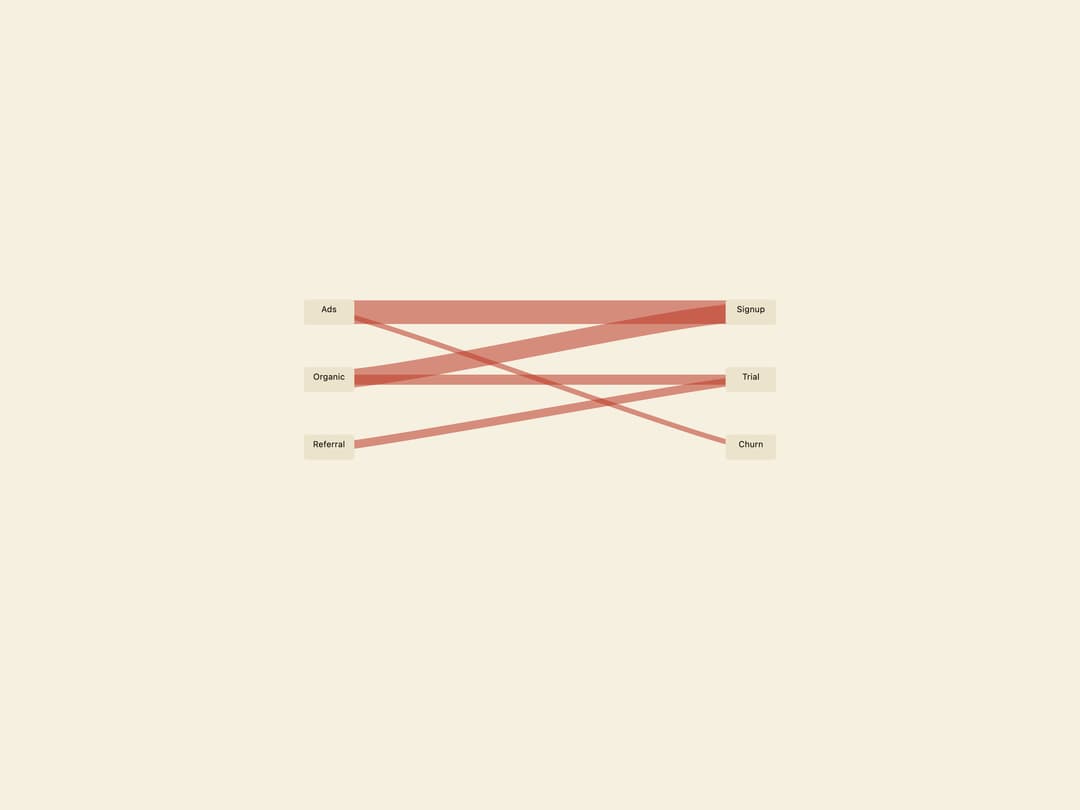
A two-level flow diagram that connects left and right nodes with bezier ribbons sized by flow value, useful for visualizing funnels, budgets or traffic sources flowing into outcomes.
Built with React and Tailwind. Copy the prompt and paste it into Claude Code, Cursor or Lovable: your agent adds Sankey Chart to your project and fits it to your theme.
Code
How Sankey Chart is used: the demo's code. The component's own source comes with a free account.
Usage.tsx
import SankeyChart from "@/components/ui/sankey-chart";

const nodes = [
  { id: "ads", label: "Ads", side: "left" as const },
  { id: "organic", label: "Organic", side: "left" as const },
  { id: "referral", label: "Referral", side: "left" as const },
  { id: "signup", label: "Signup", side: "right" as const },
  { id: "trial", label: "Trial", side: "right" as const },
  { id: "churn", label: "Churn", side: "right" as const },
];

const flows = [
  { from: "ads", to: "signup", value: 1.4 },
  { from: "organic", to: "signup", value: 1.1 },
  { from: "organic", to: "trial", value: 0.6 },
  { from: "referral", to: "trial", value: 0.5 },
  { from: "ads", to: "churn", value: 0.3 },
];

export default function SankeyChartDemo() {
  return (
    <div className="flex w-full items-center justify-center bg-background p-8 text-foreground">
      <SankeyChart nodes={nodes} flows={flows} />
    </div>
  );
}
More by f0rextasy
View all
Newsletter Signup Card
19
Board Checklist
15
Stamp Seal
15
Network Graph
14
Navbar
12
Running Order Timeline
11
Milestone Chart
10
Empty State Card
7