HomeBookmarks
Evil ChartsEvil Charts
Evil Charts

Evil Charts

Open-source collection of beautifully designed, animated chart components built with shadcn/ui and Recharts.

LDby Legion Dev
47components289.7Kviews2.4Kbookmarks

Installs all 57 components. Without our CLI, run instead.

Auto-indexed

Evil Charts contents
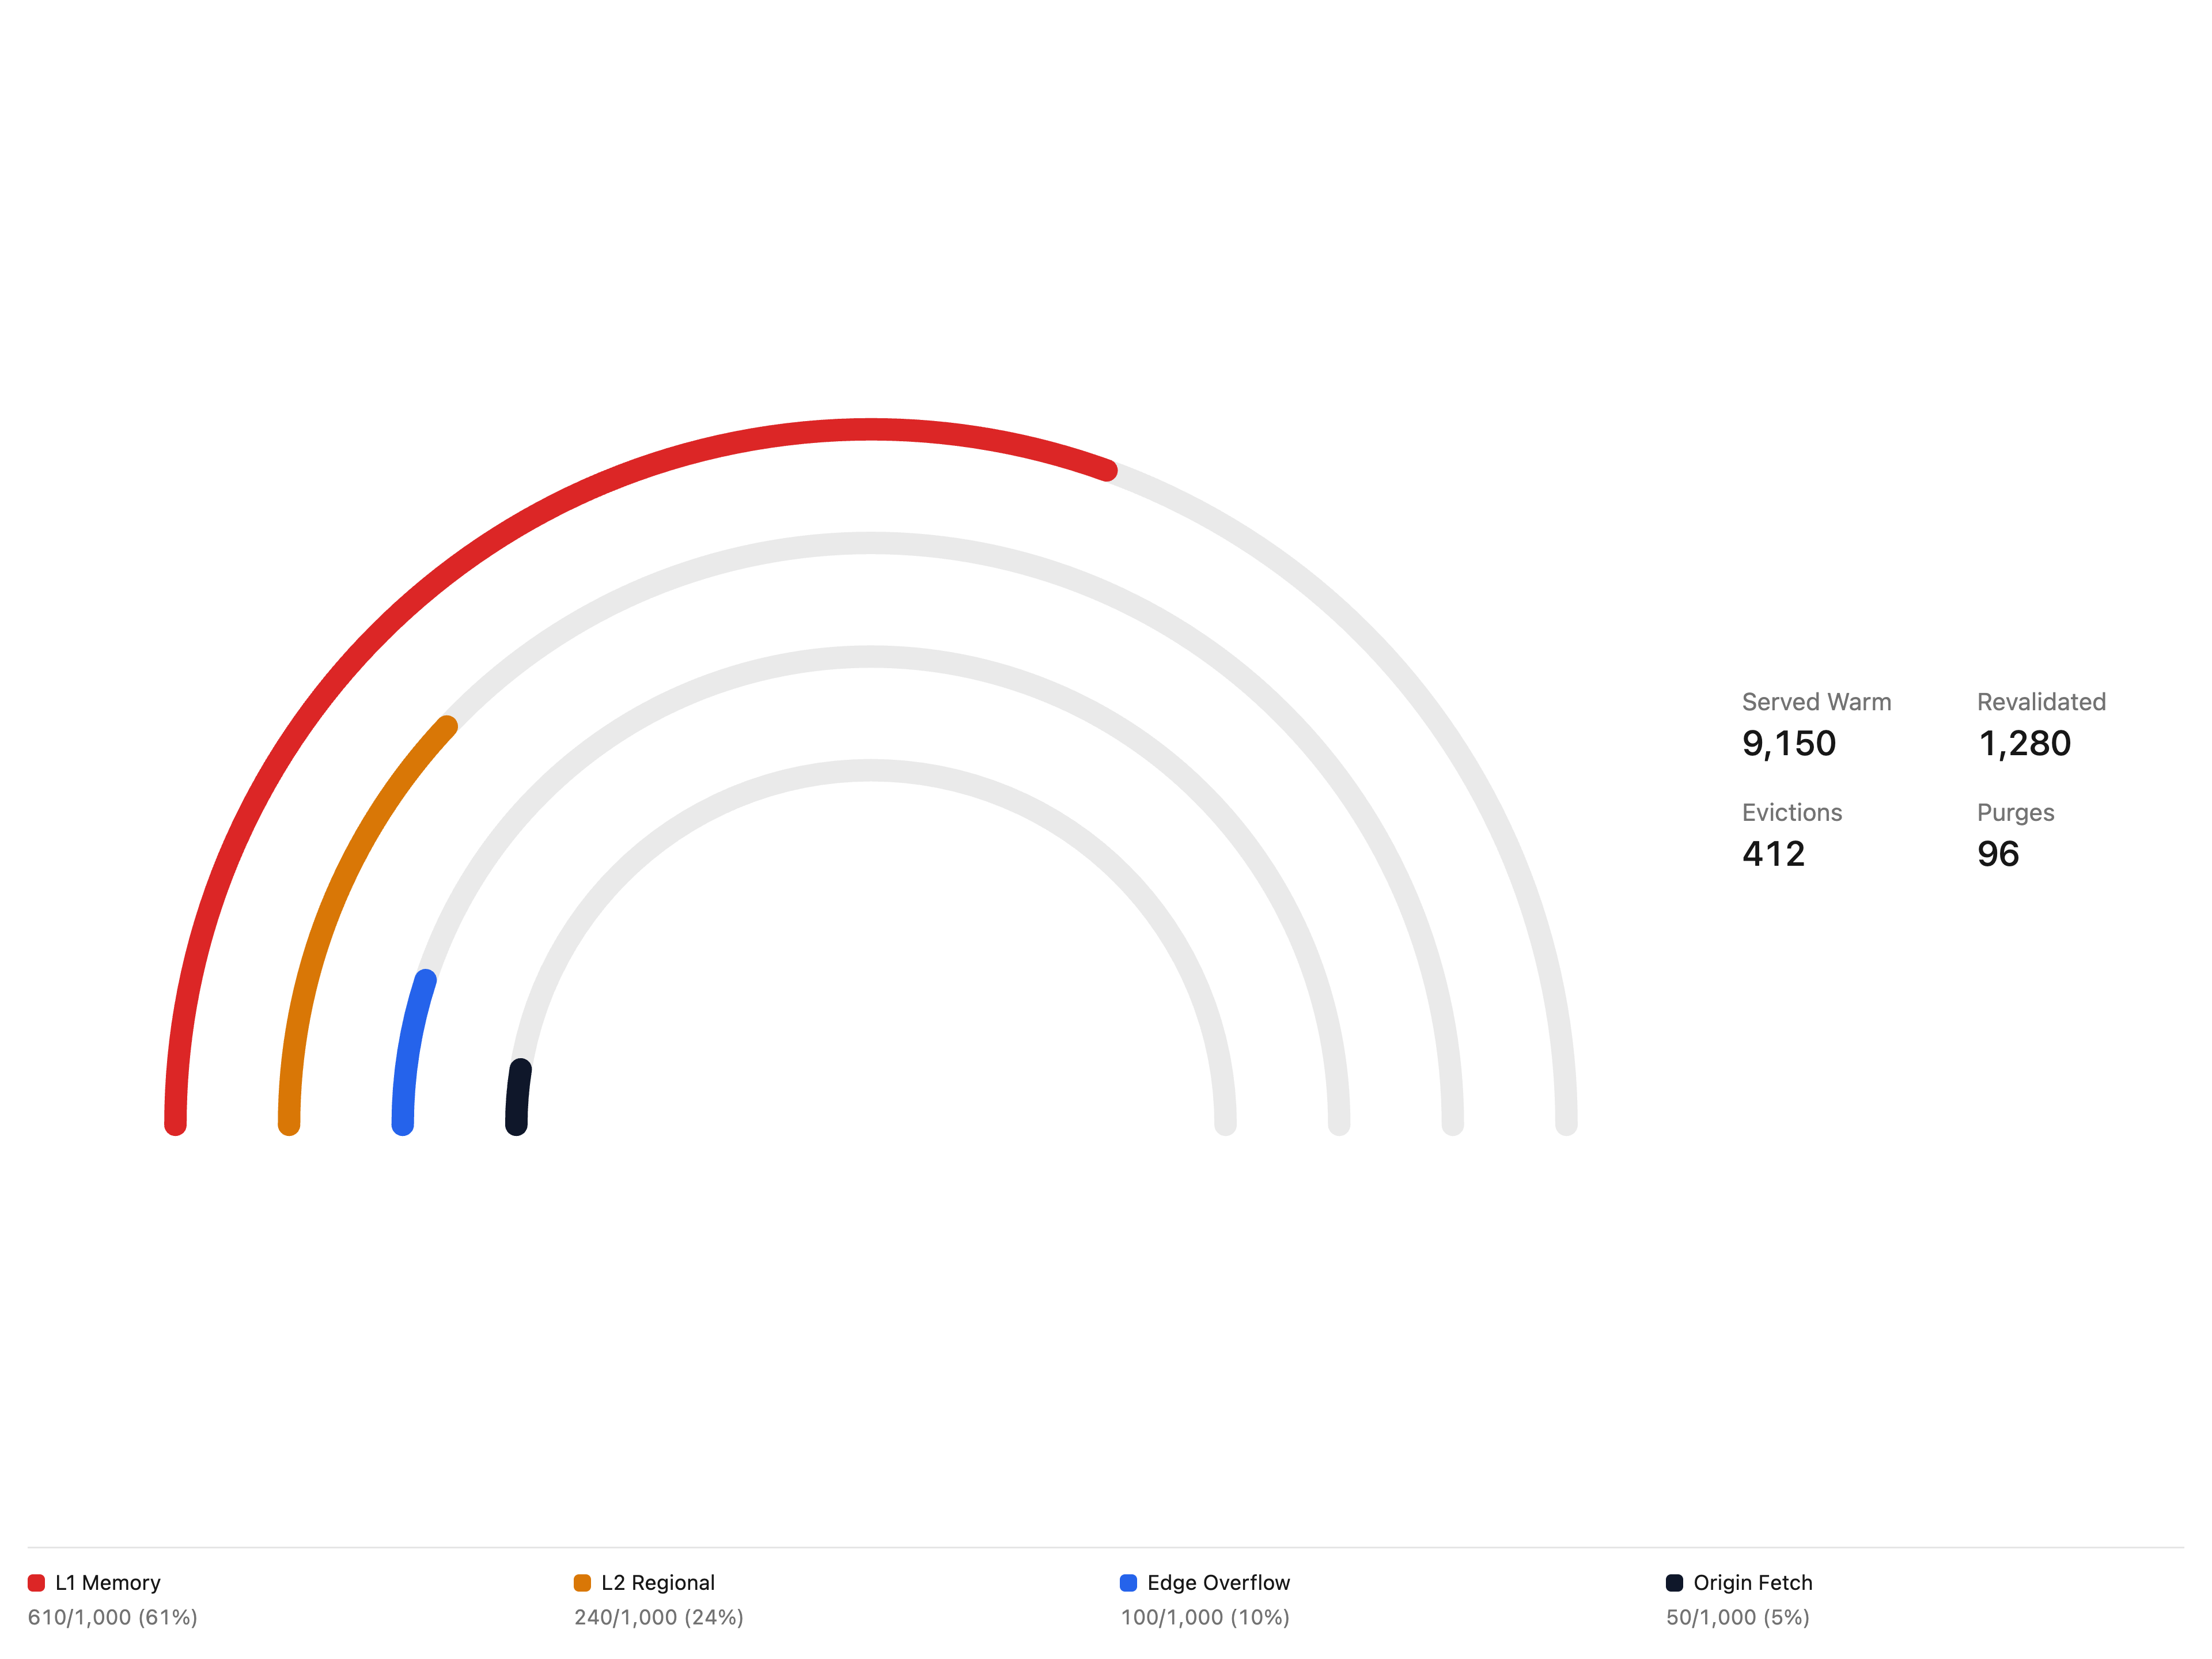
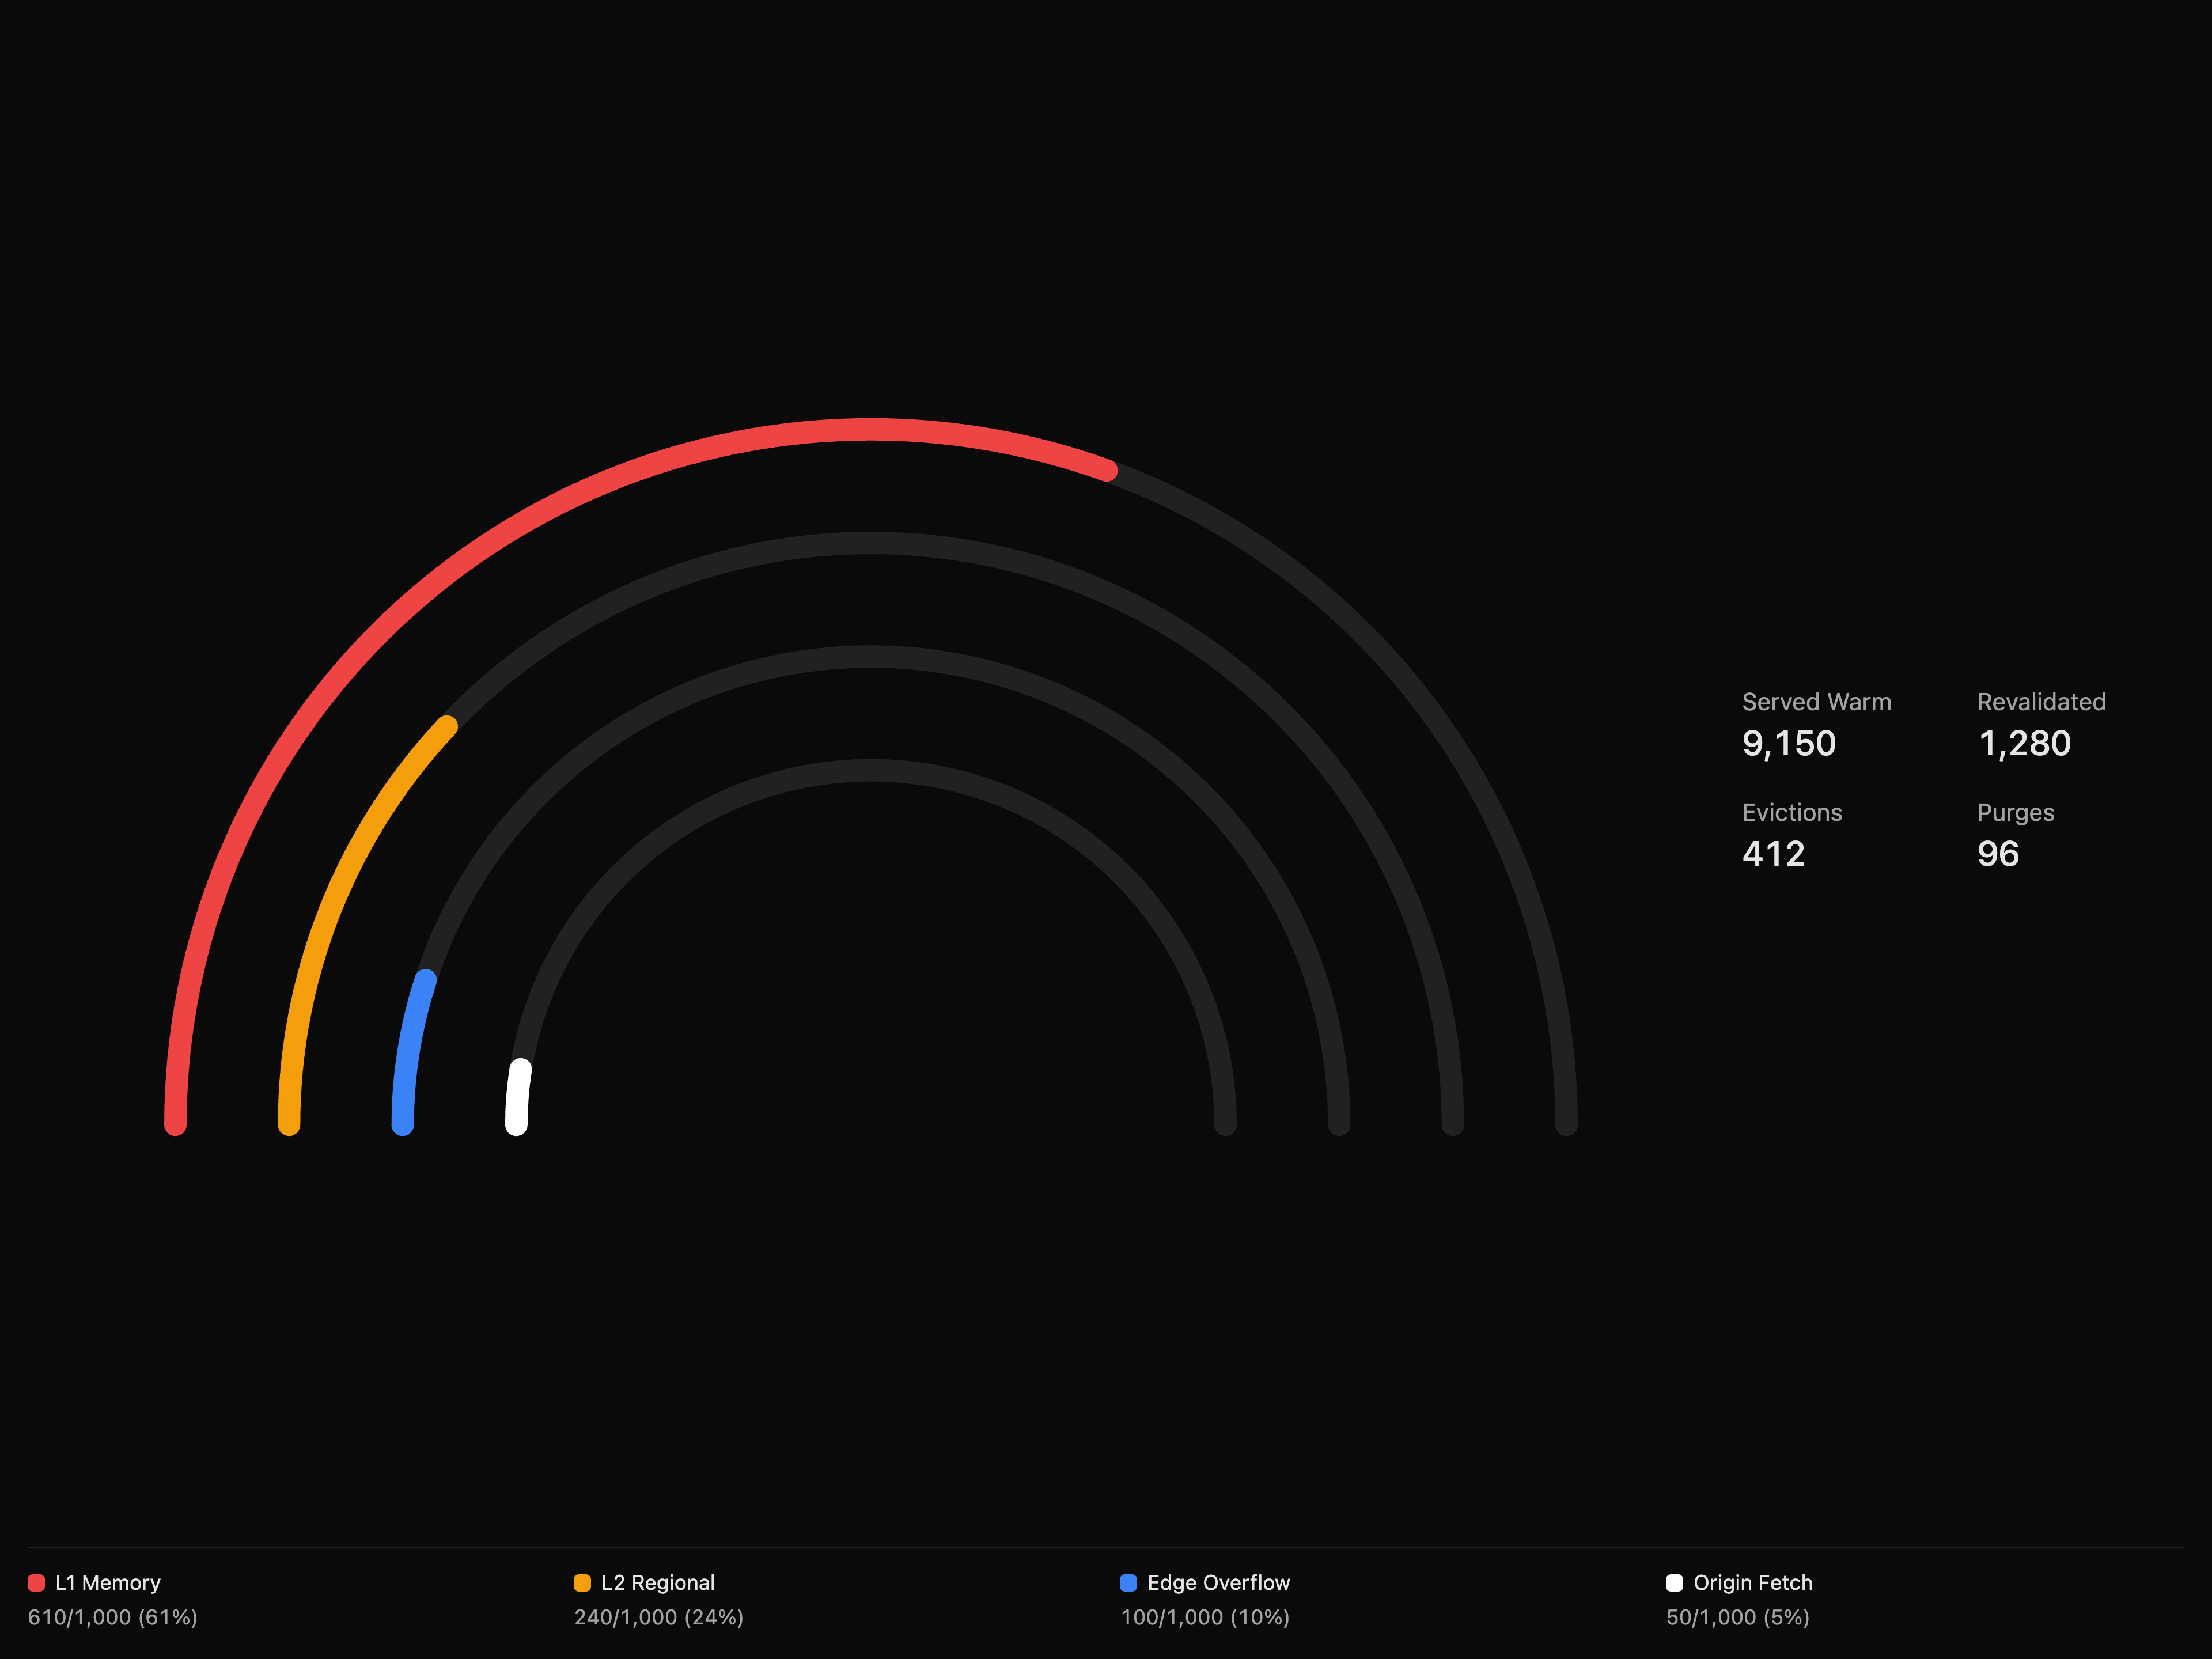
  • Cache Tiers Radial ChartCache Tiers Radial Chart

    Cache Tiers Radial Chart

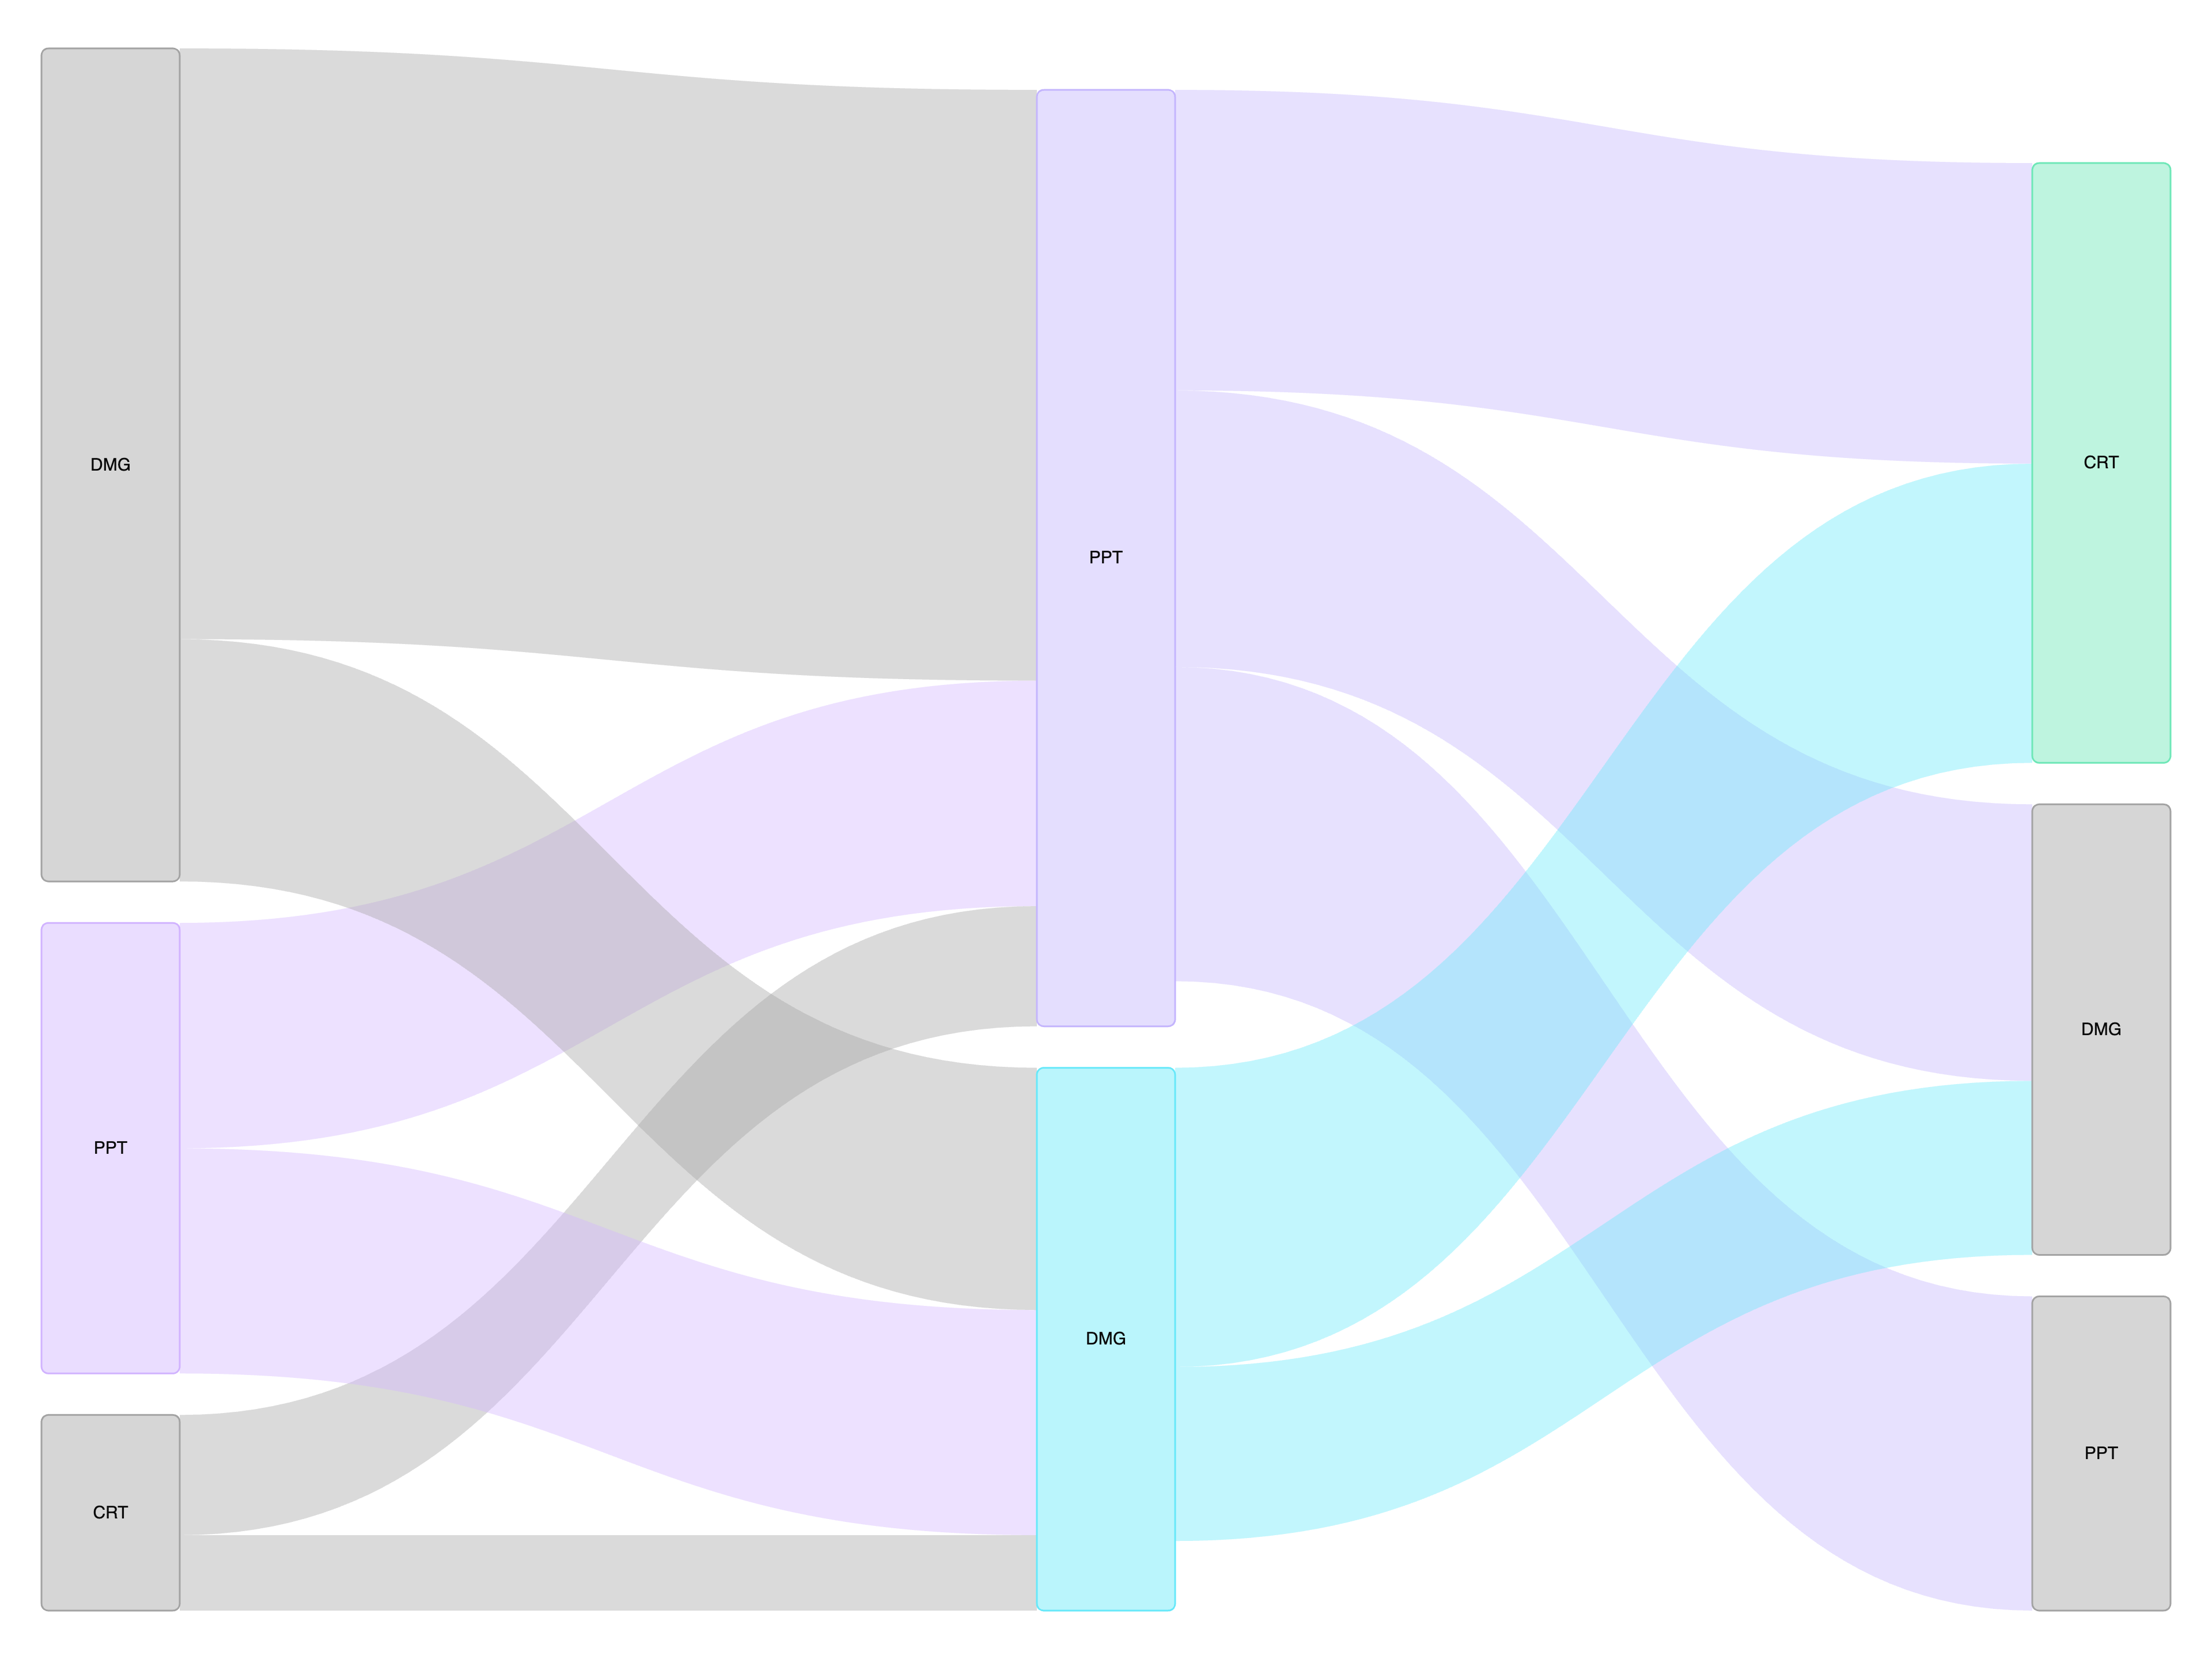
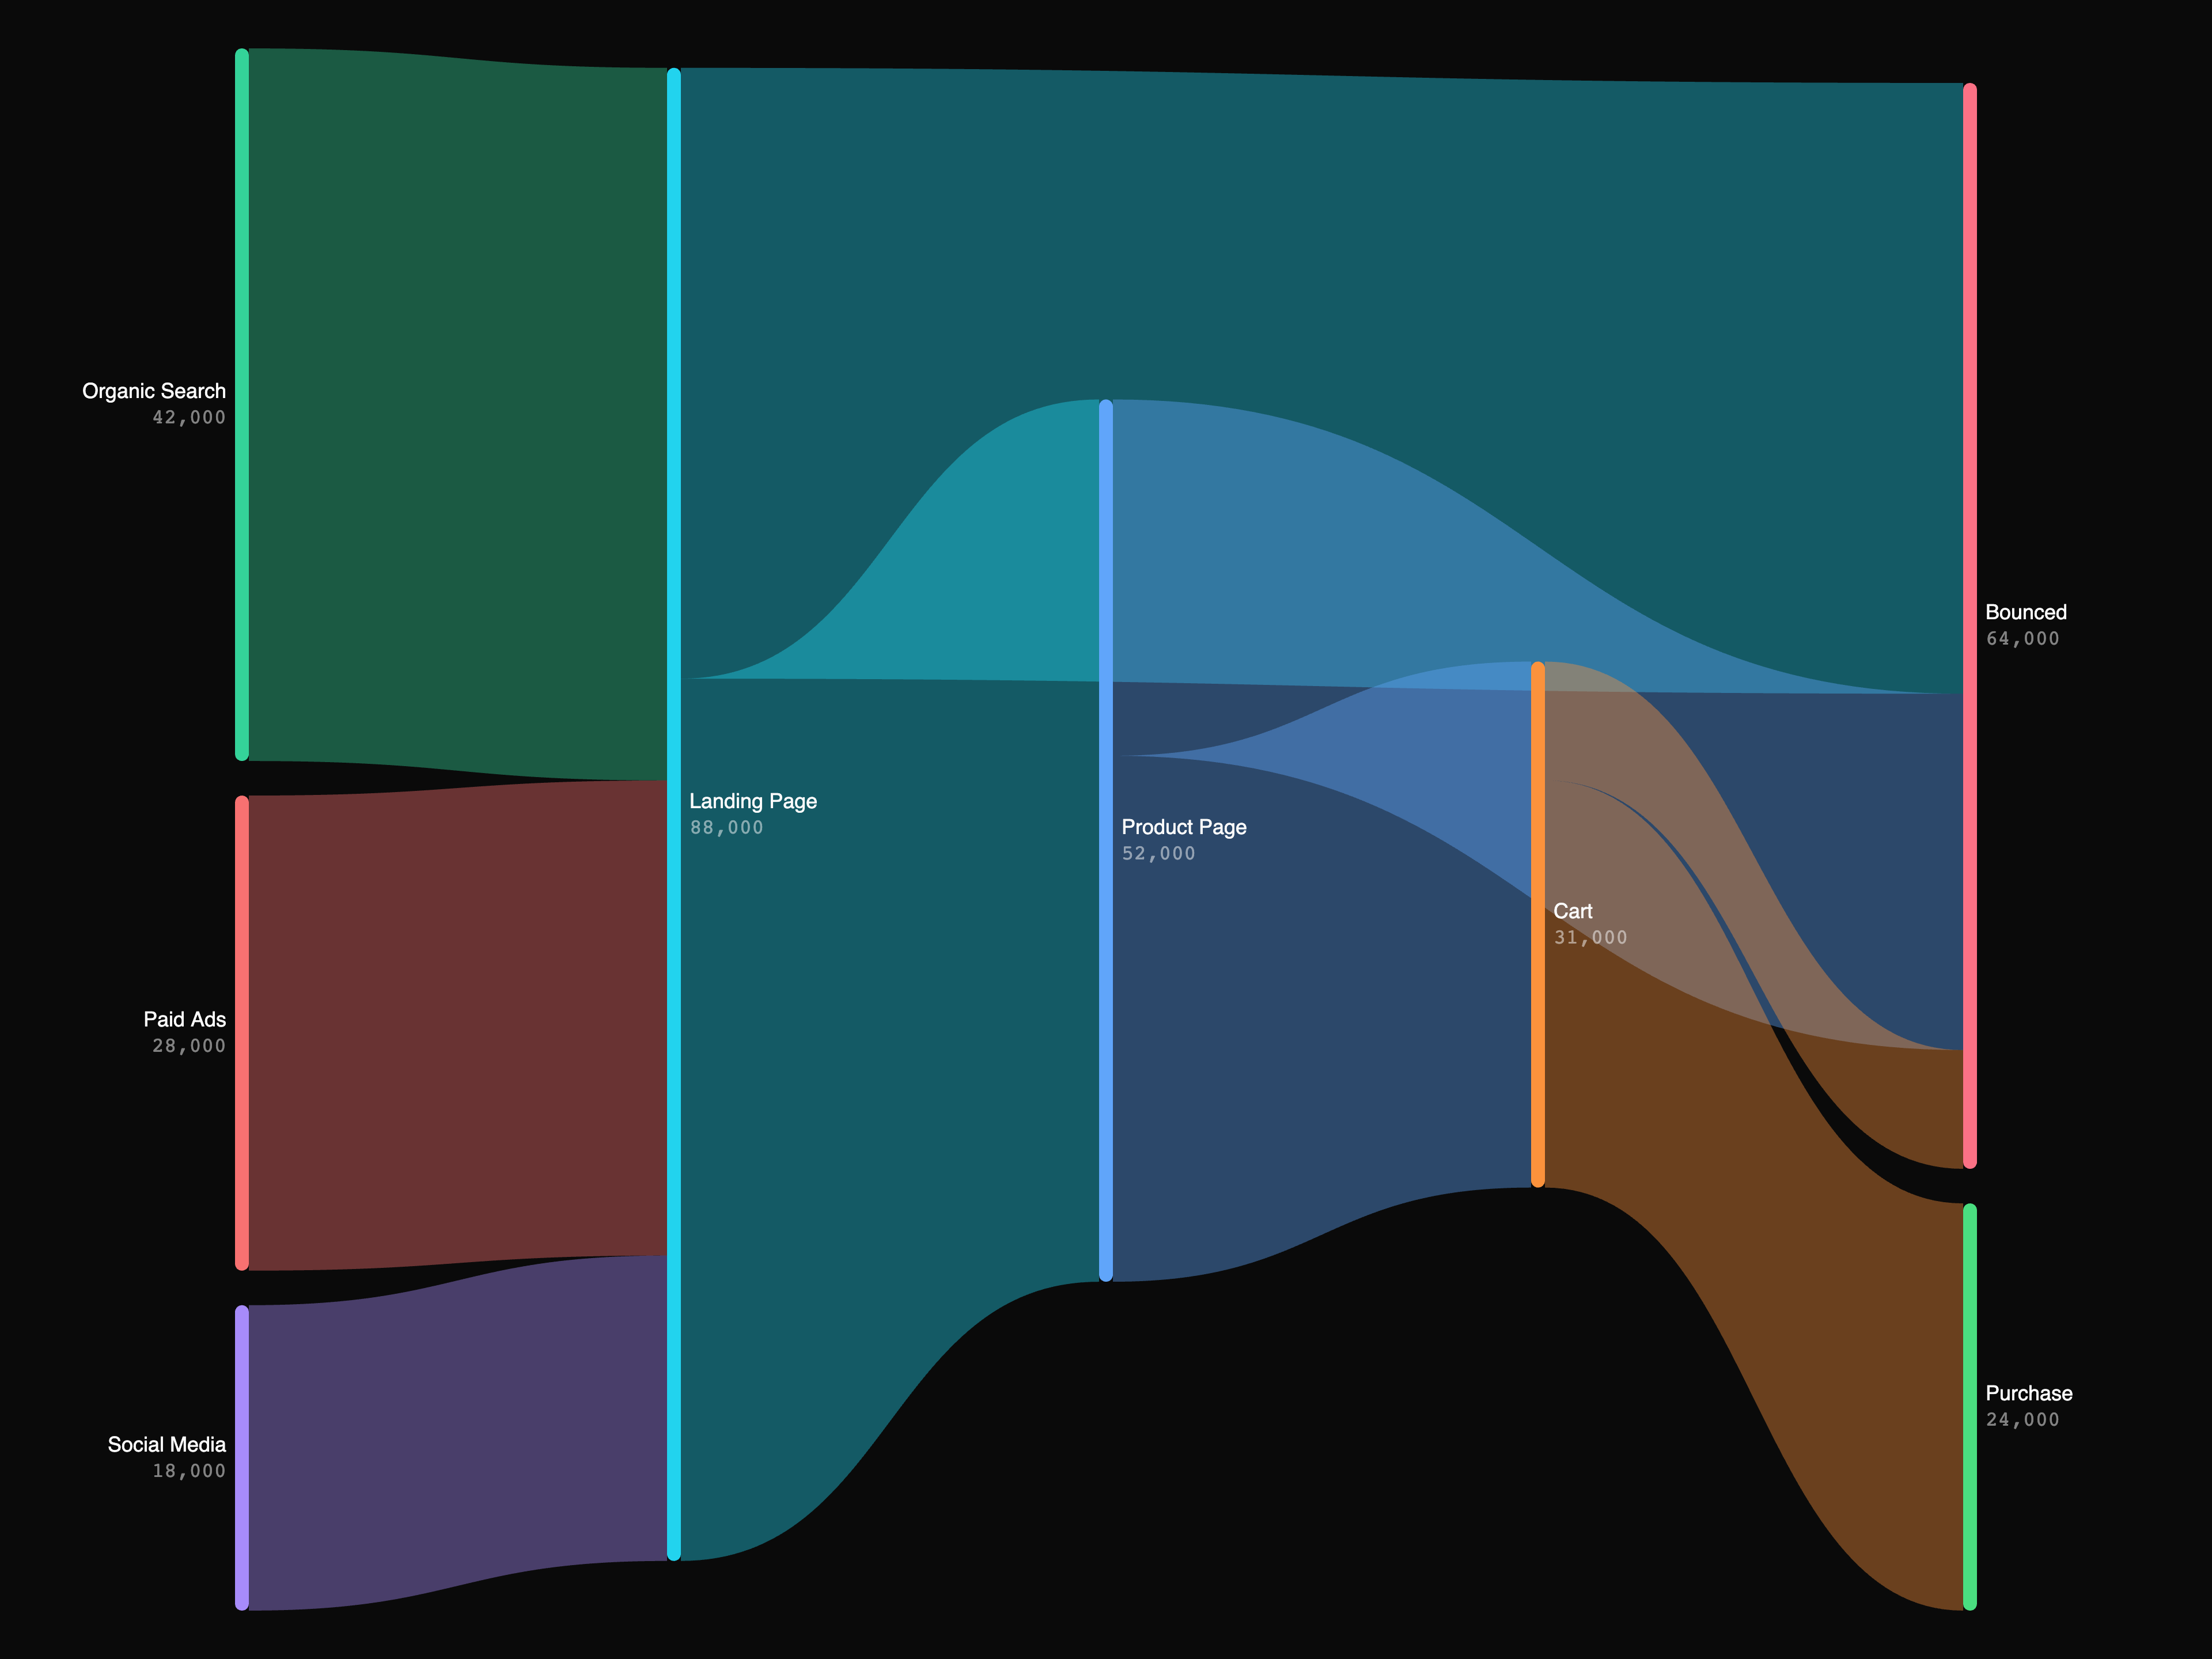
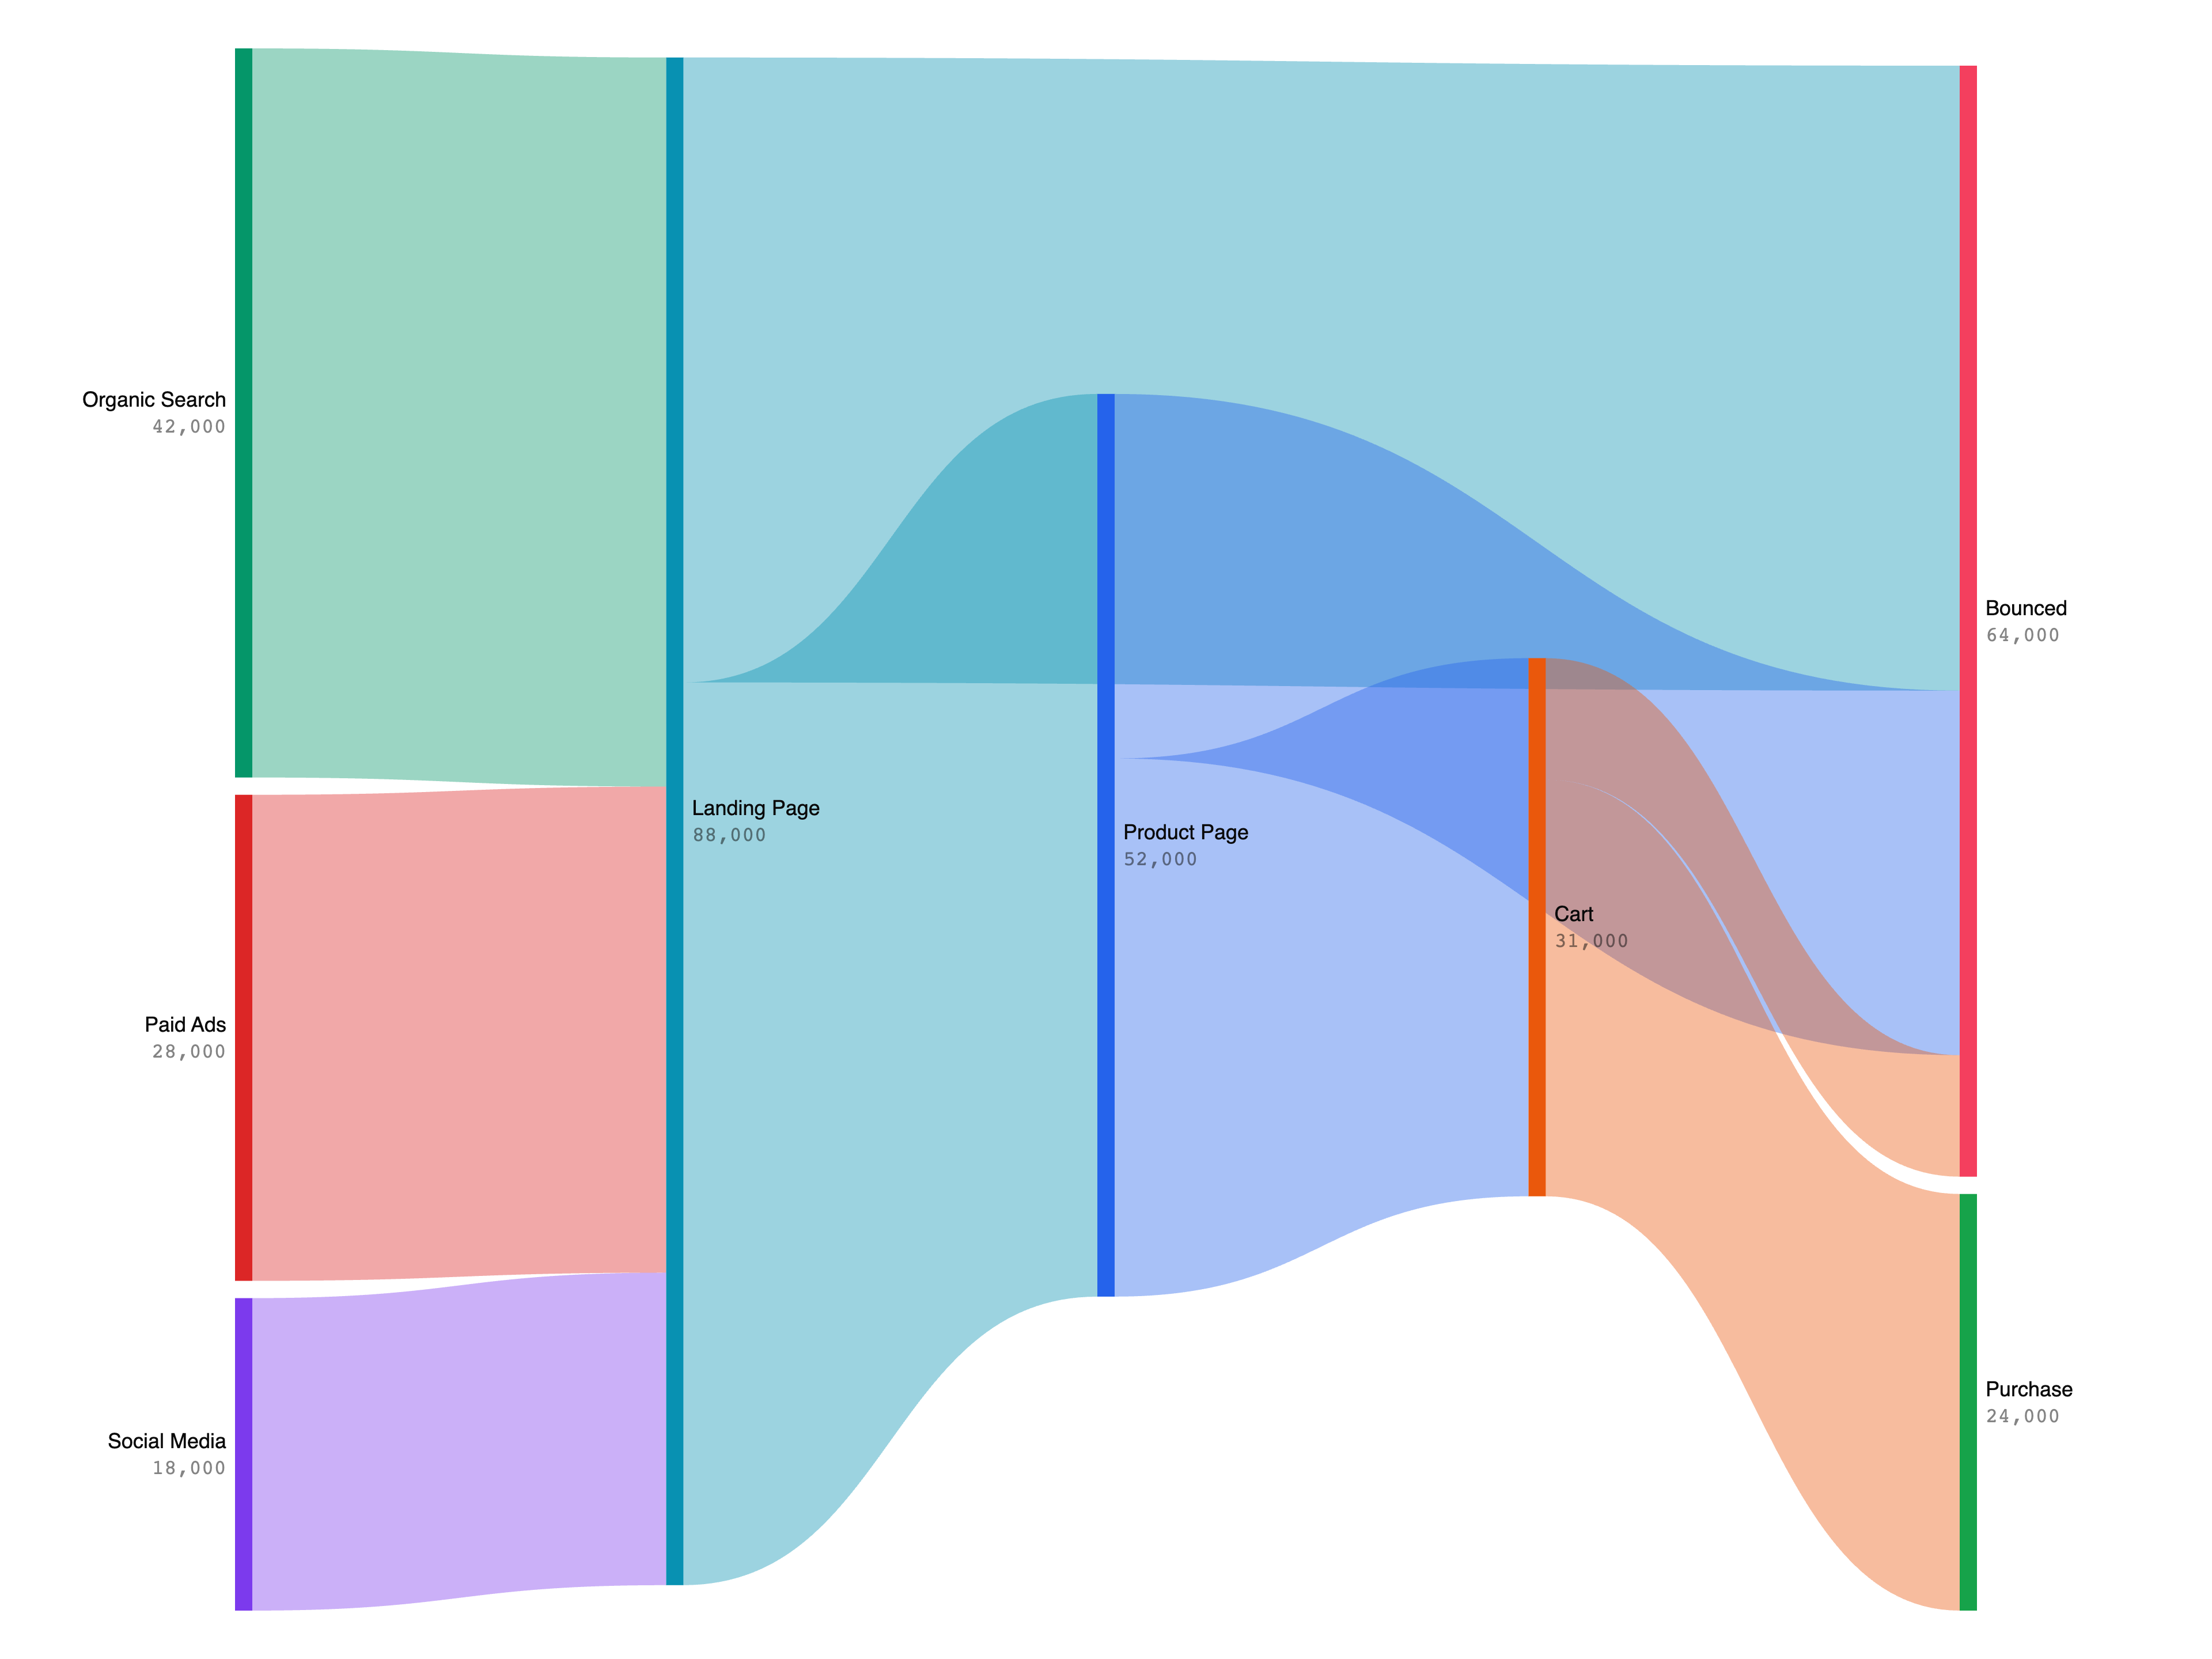
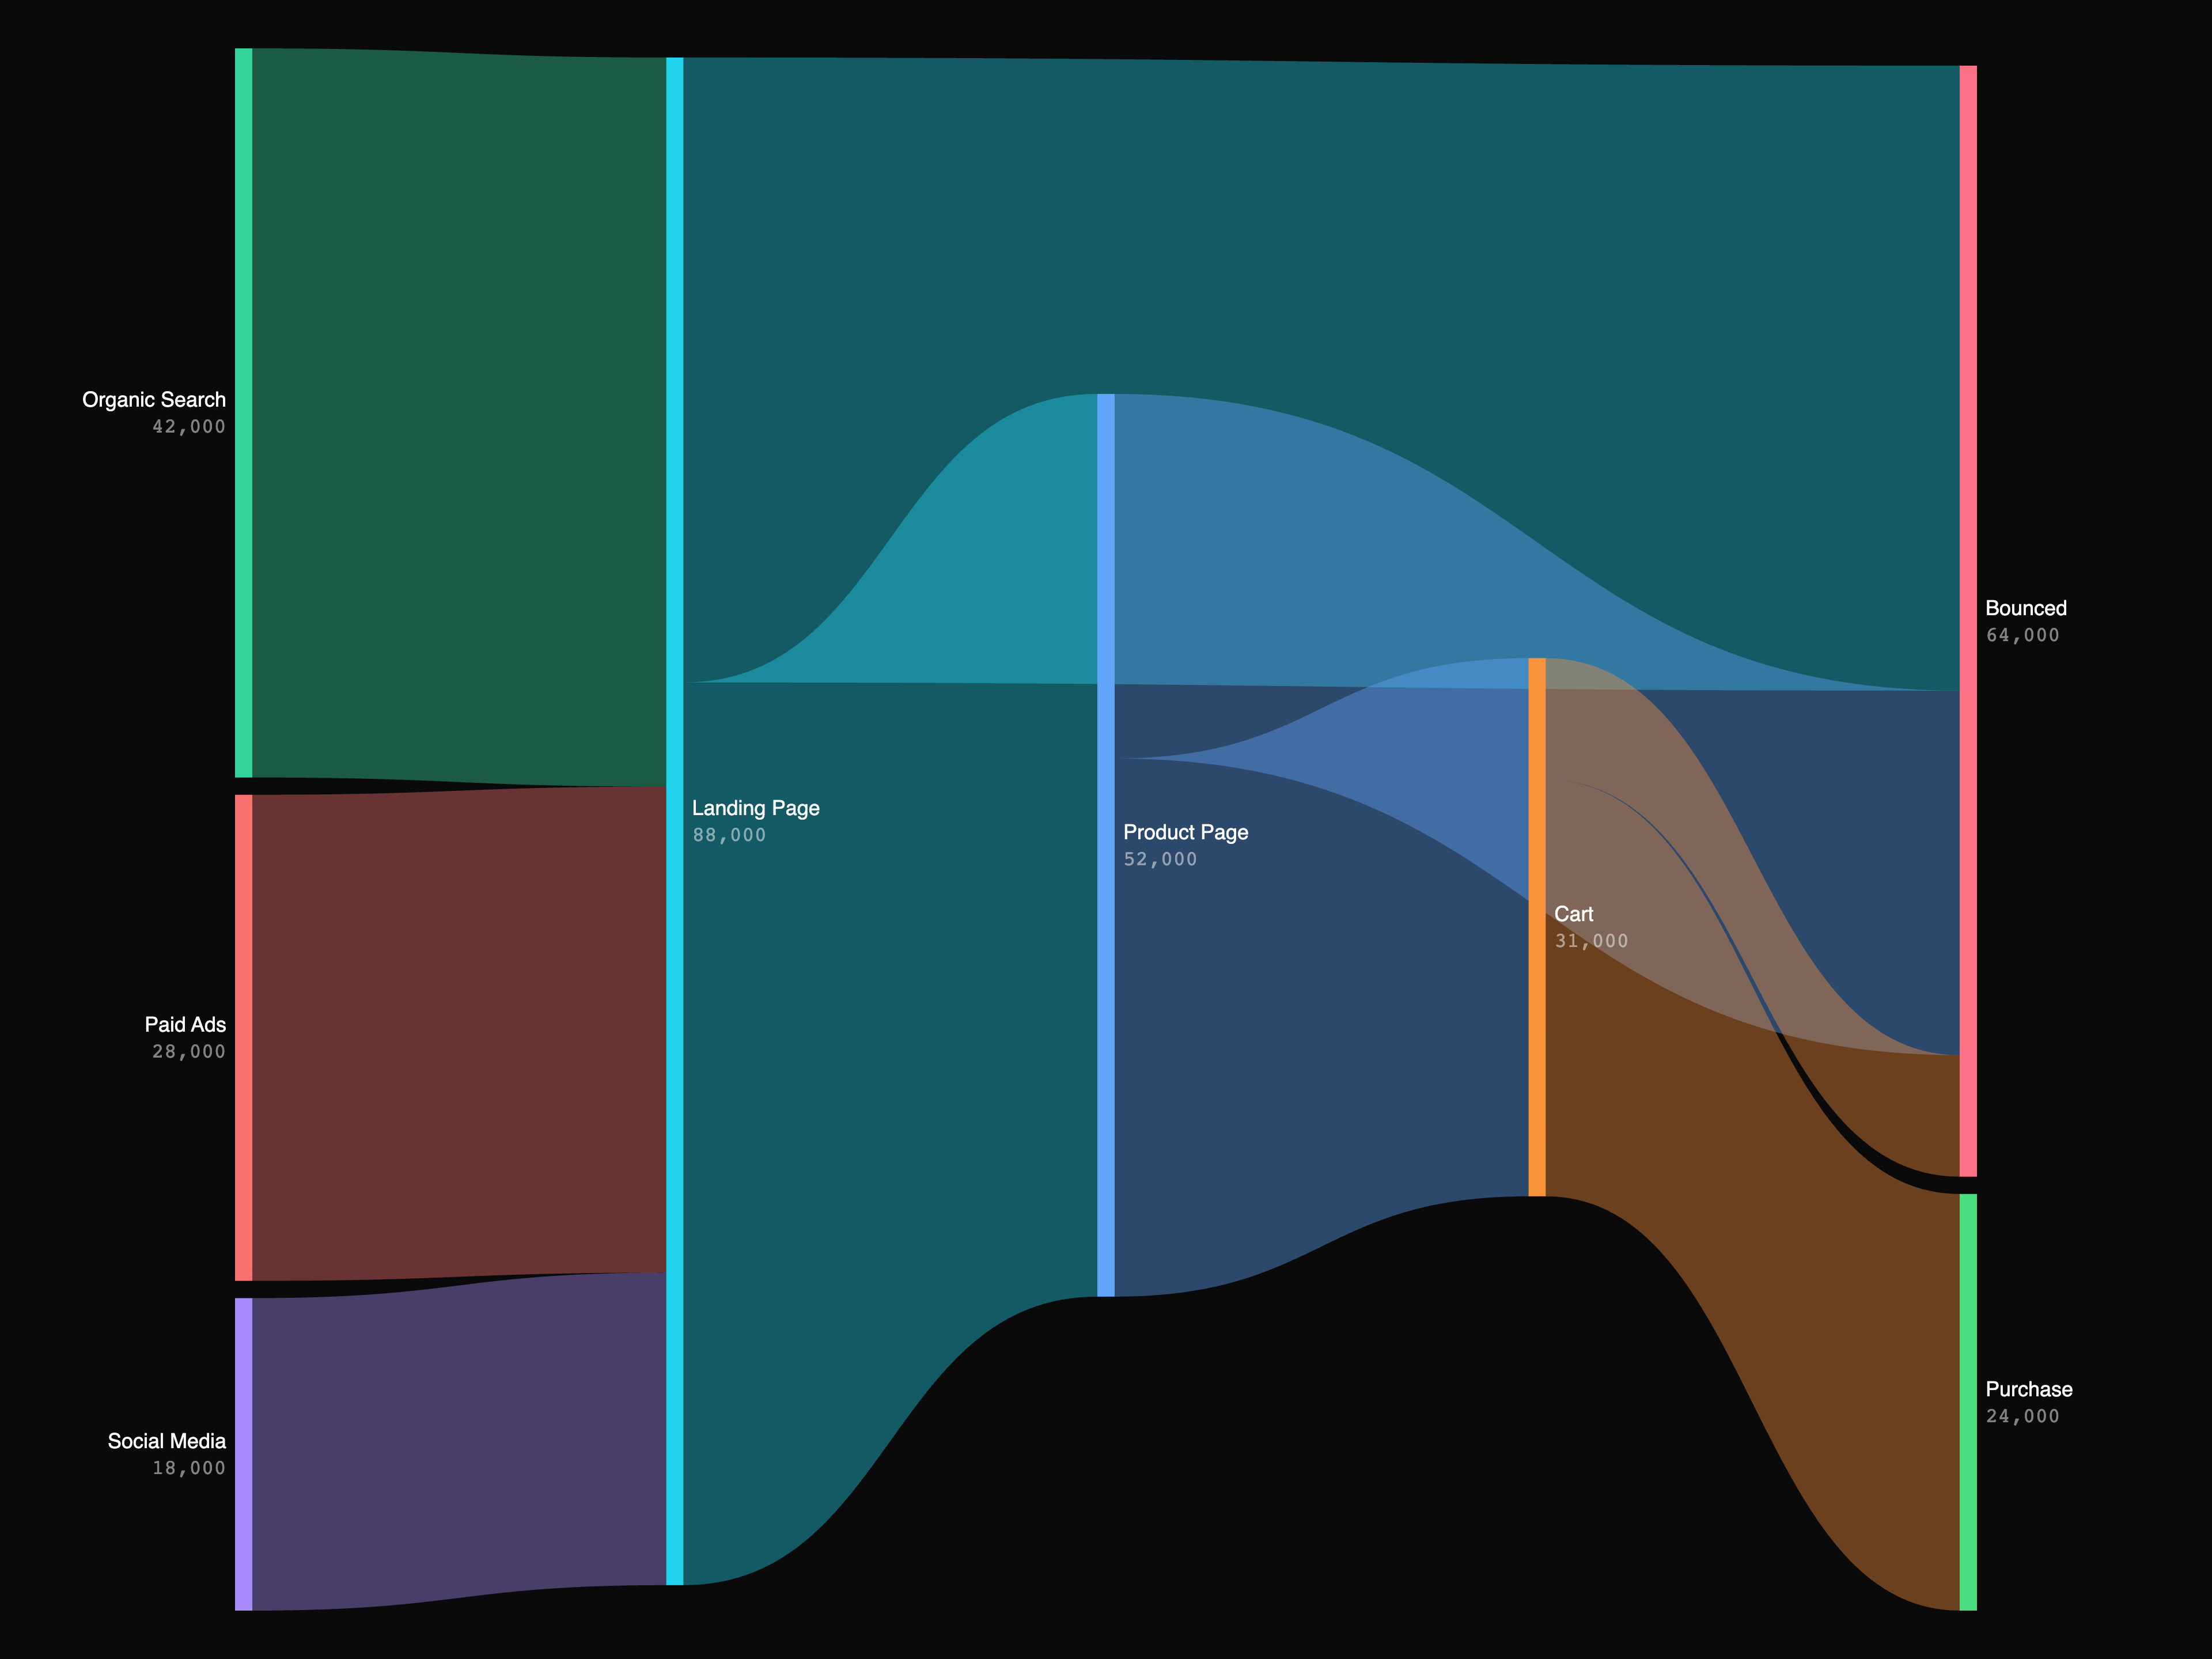
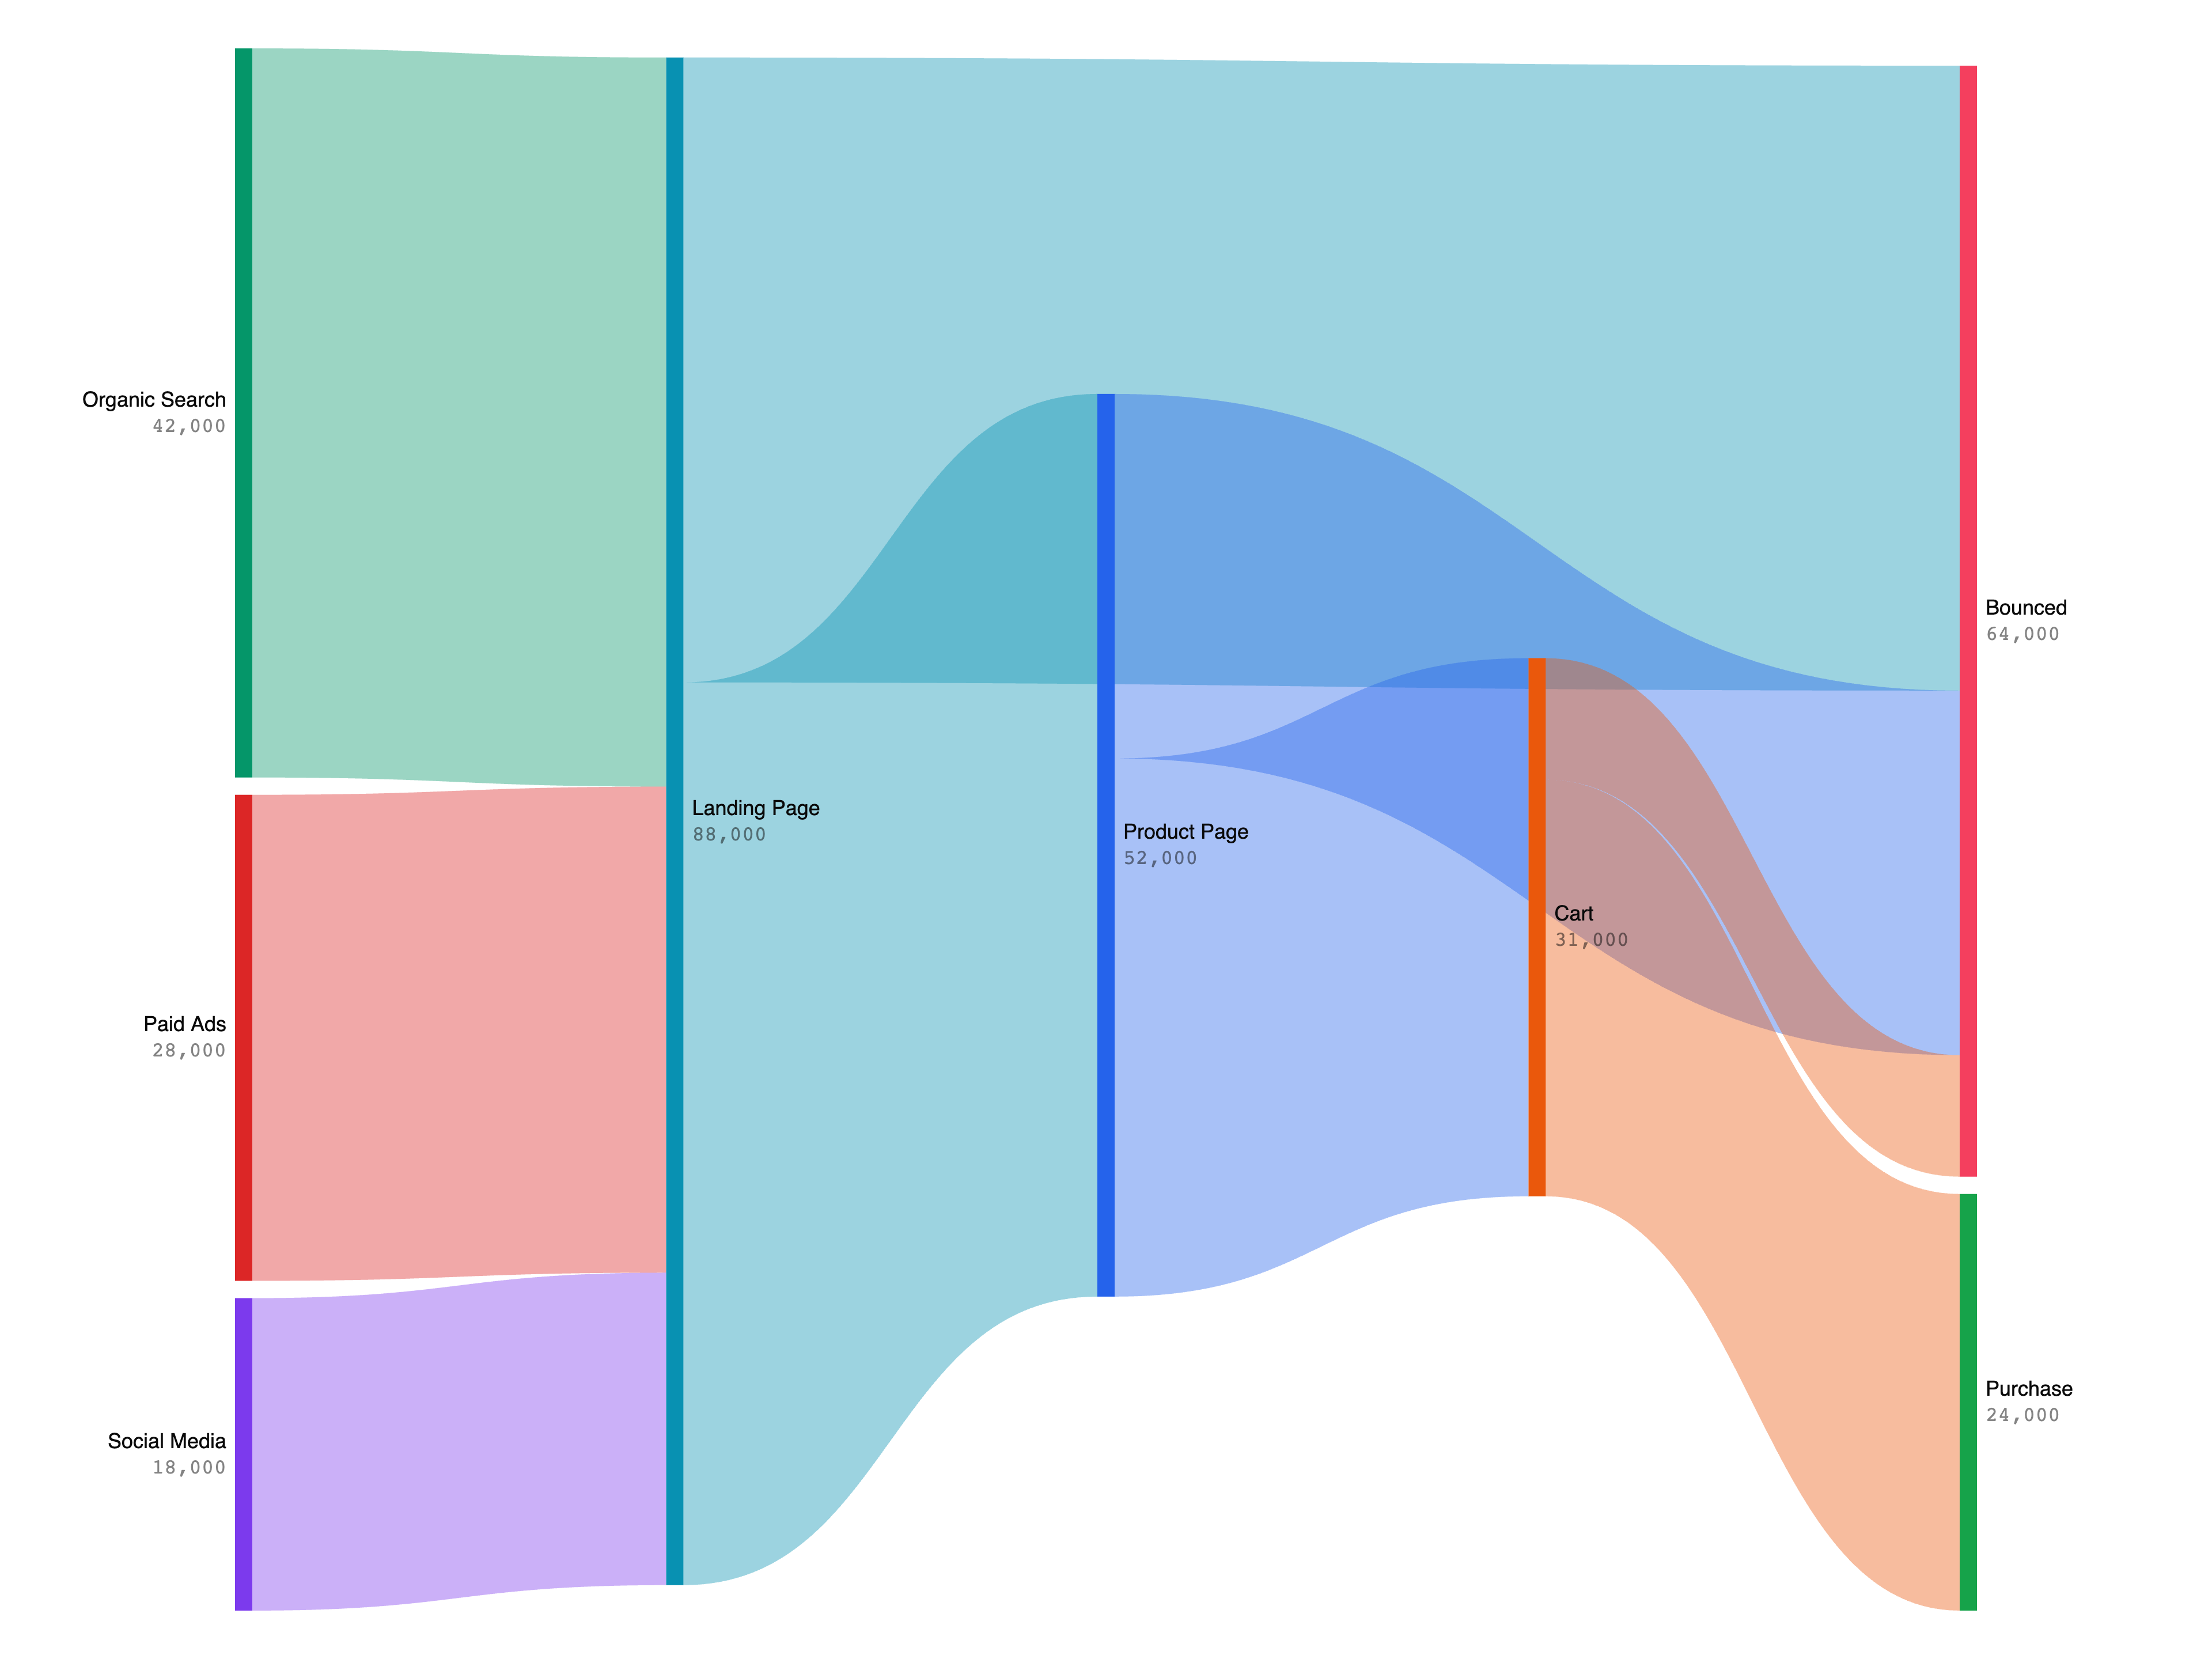
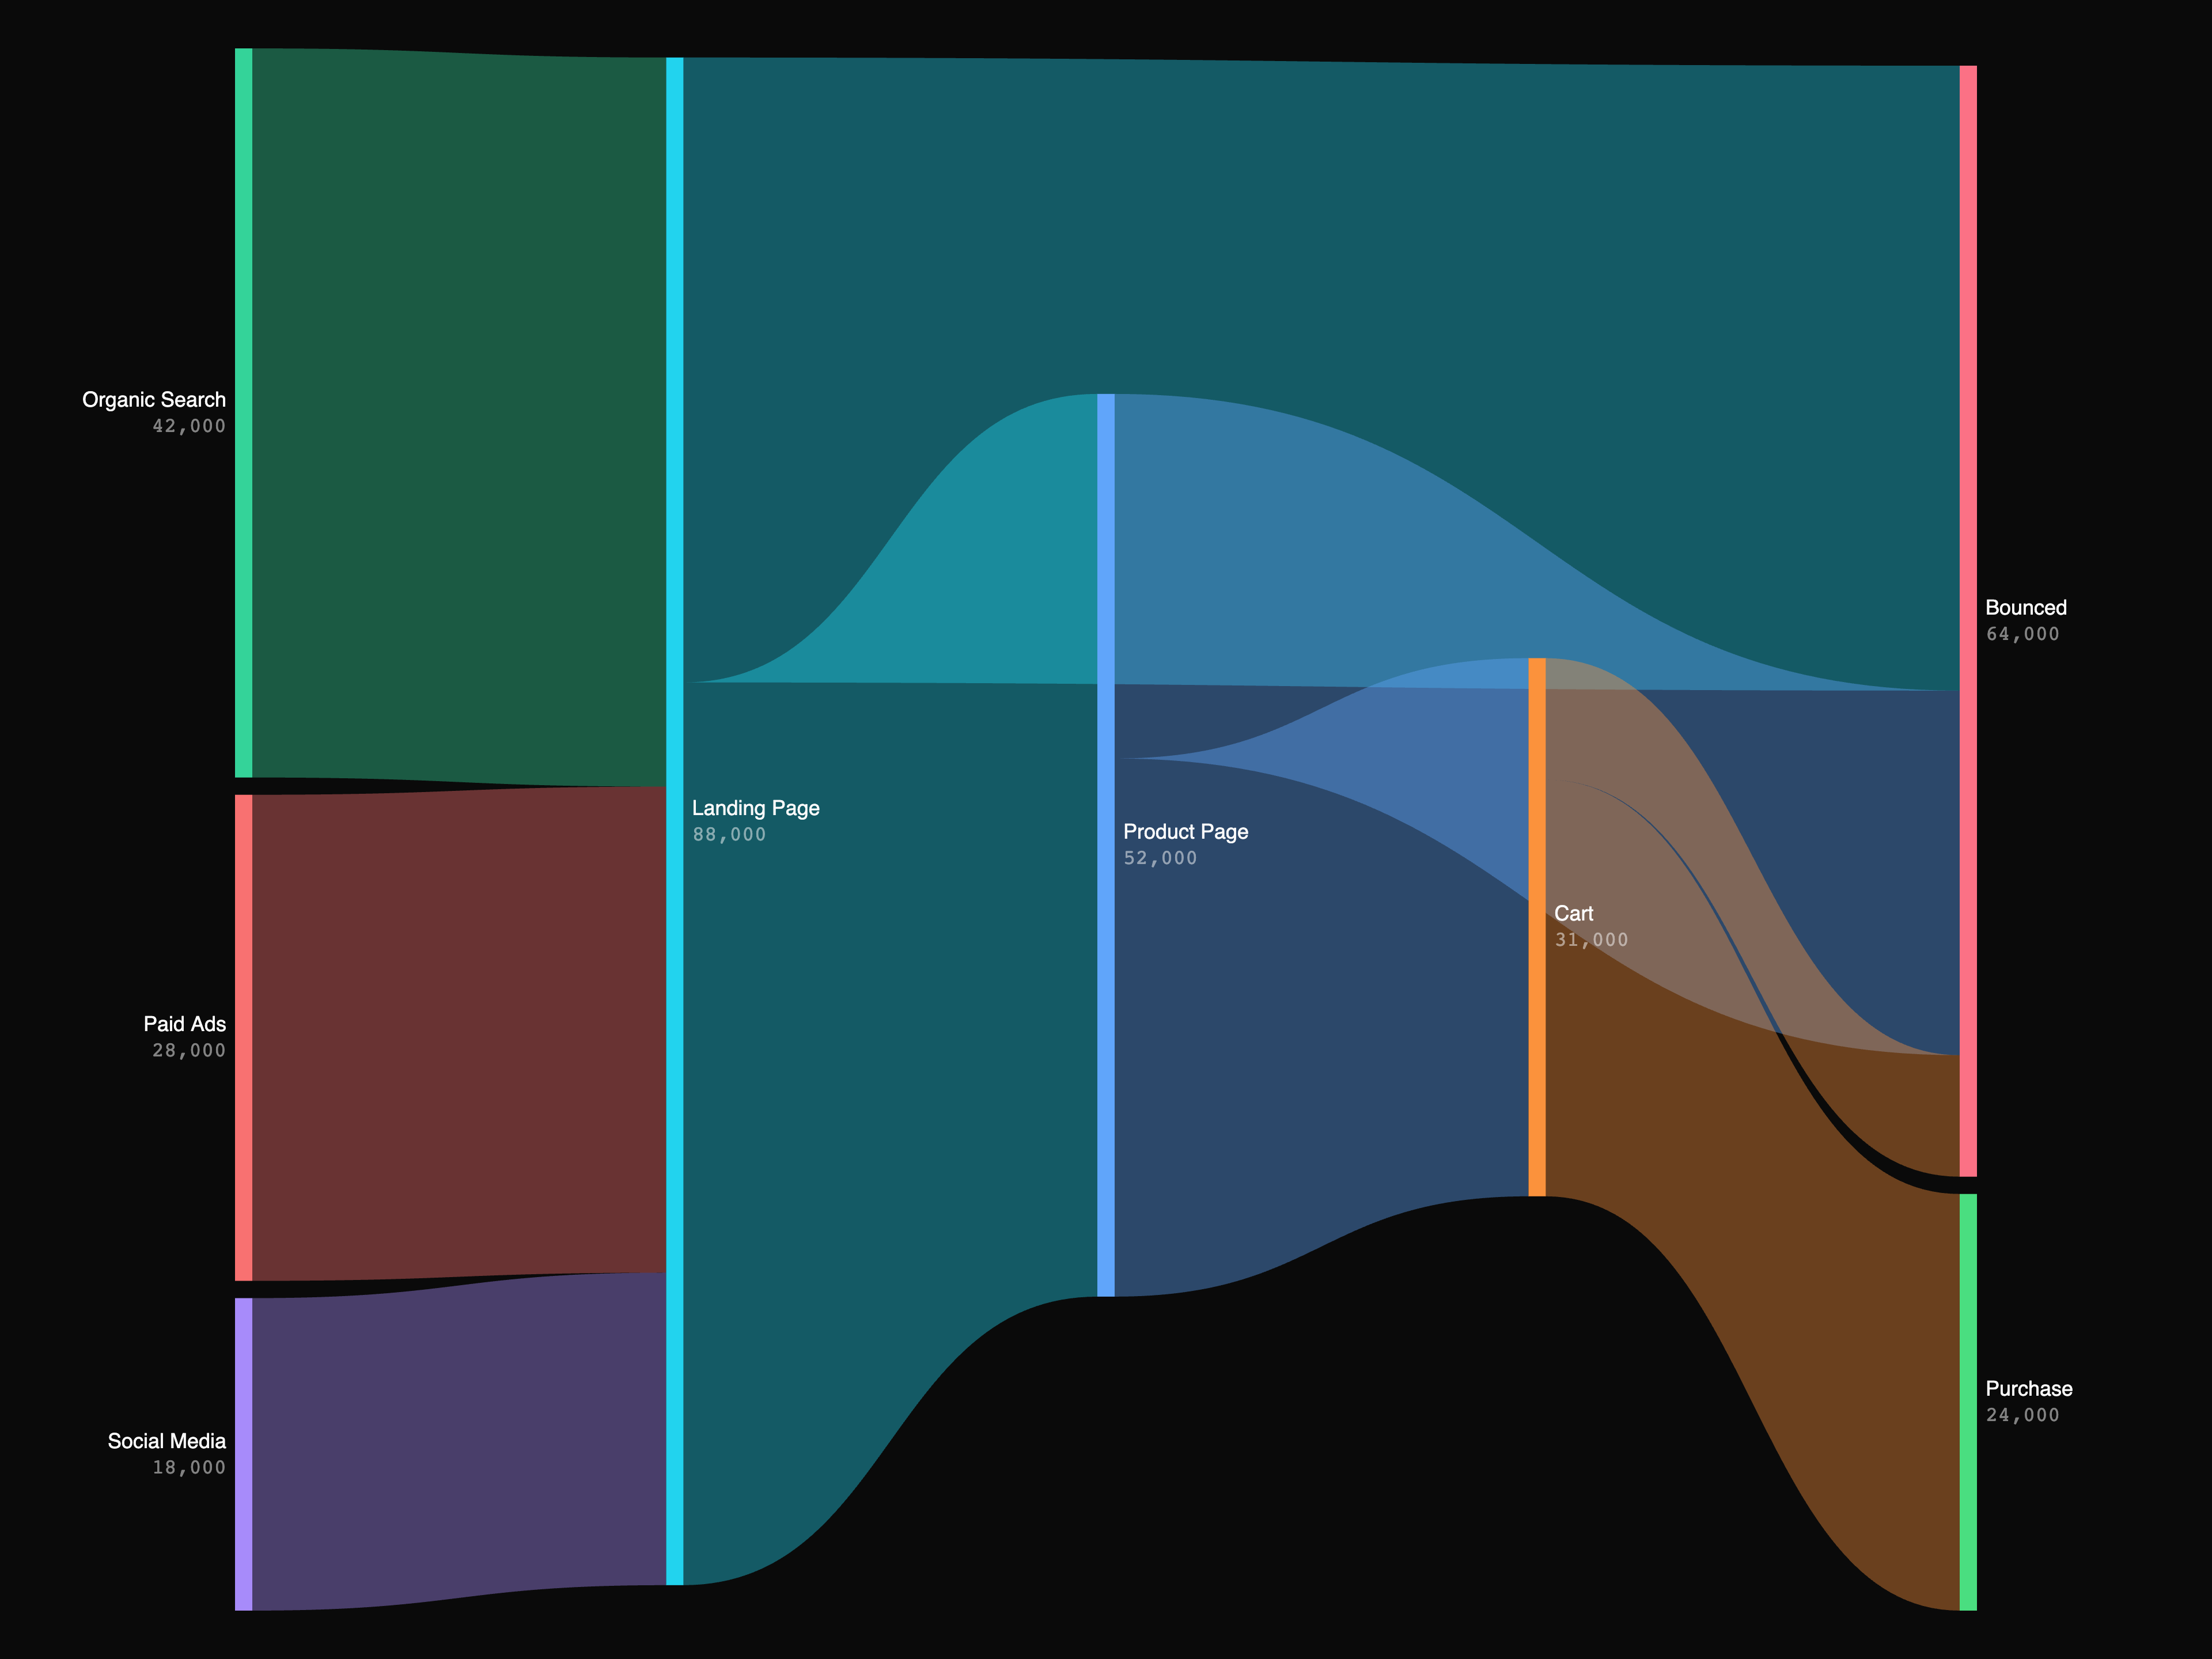
  • ECharts Sankey ChartECharts Sankey Chart

    ECharts Sankey Chart
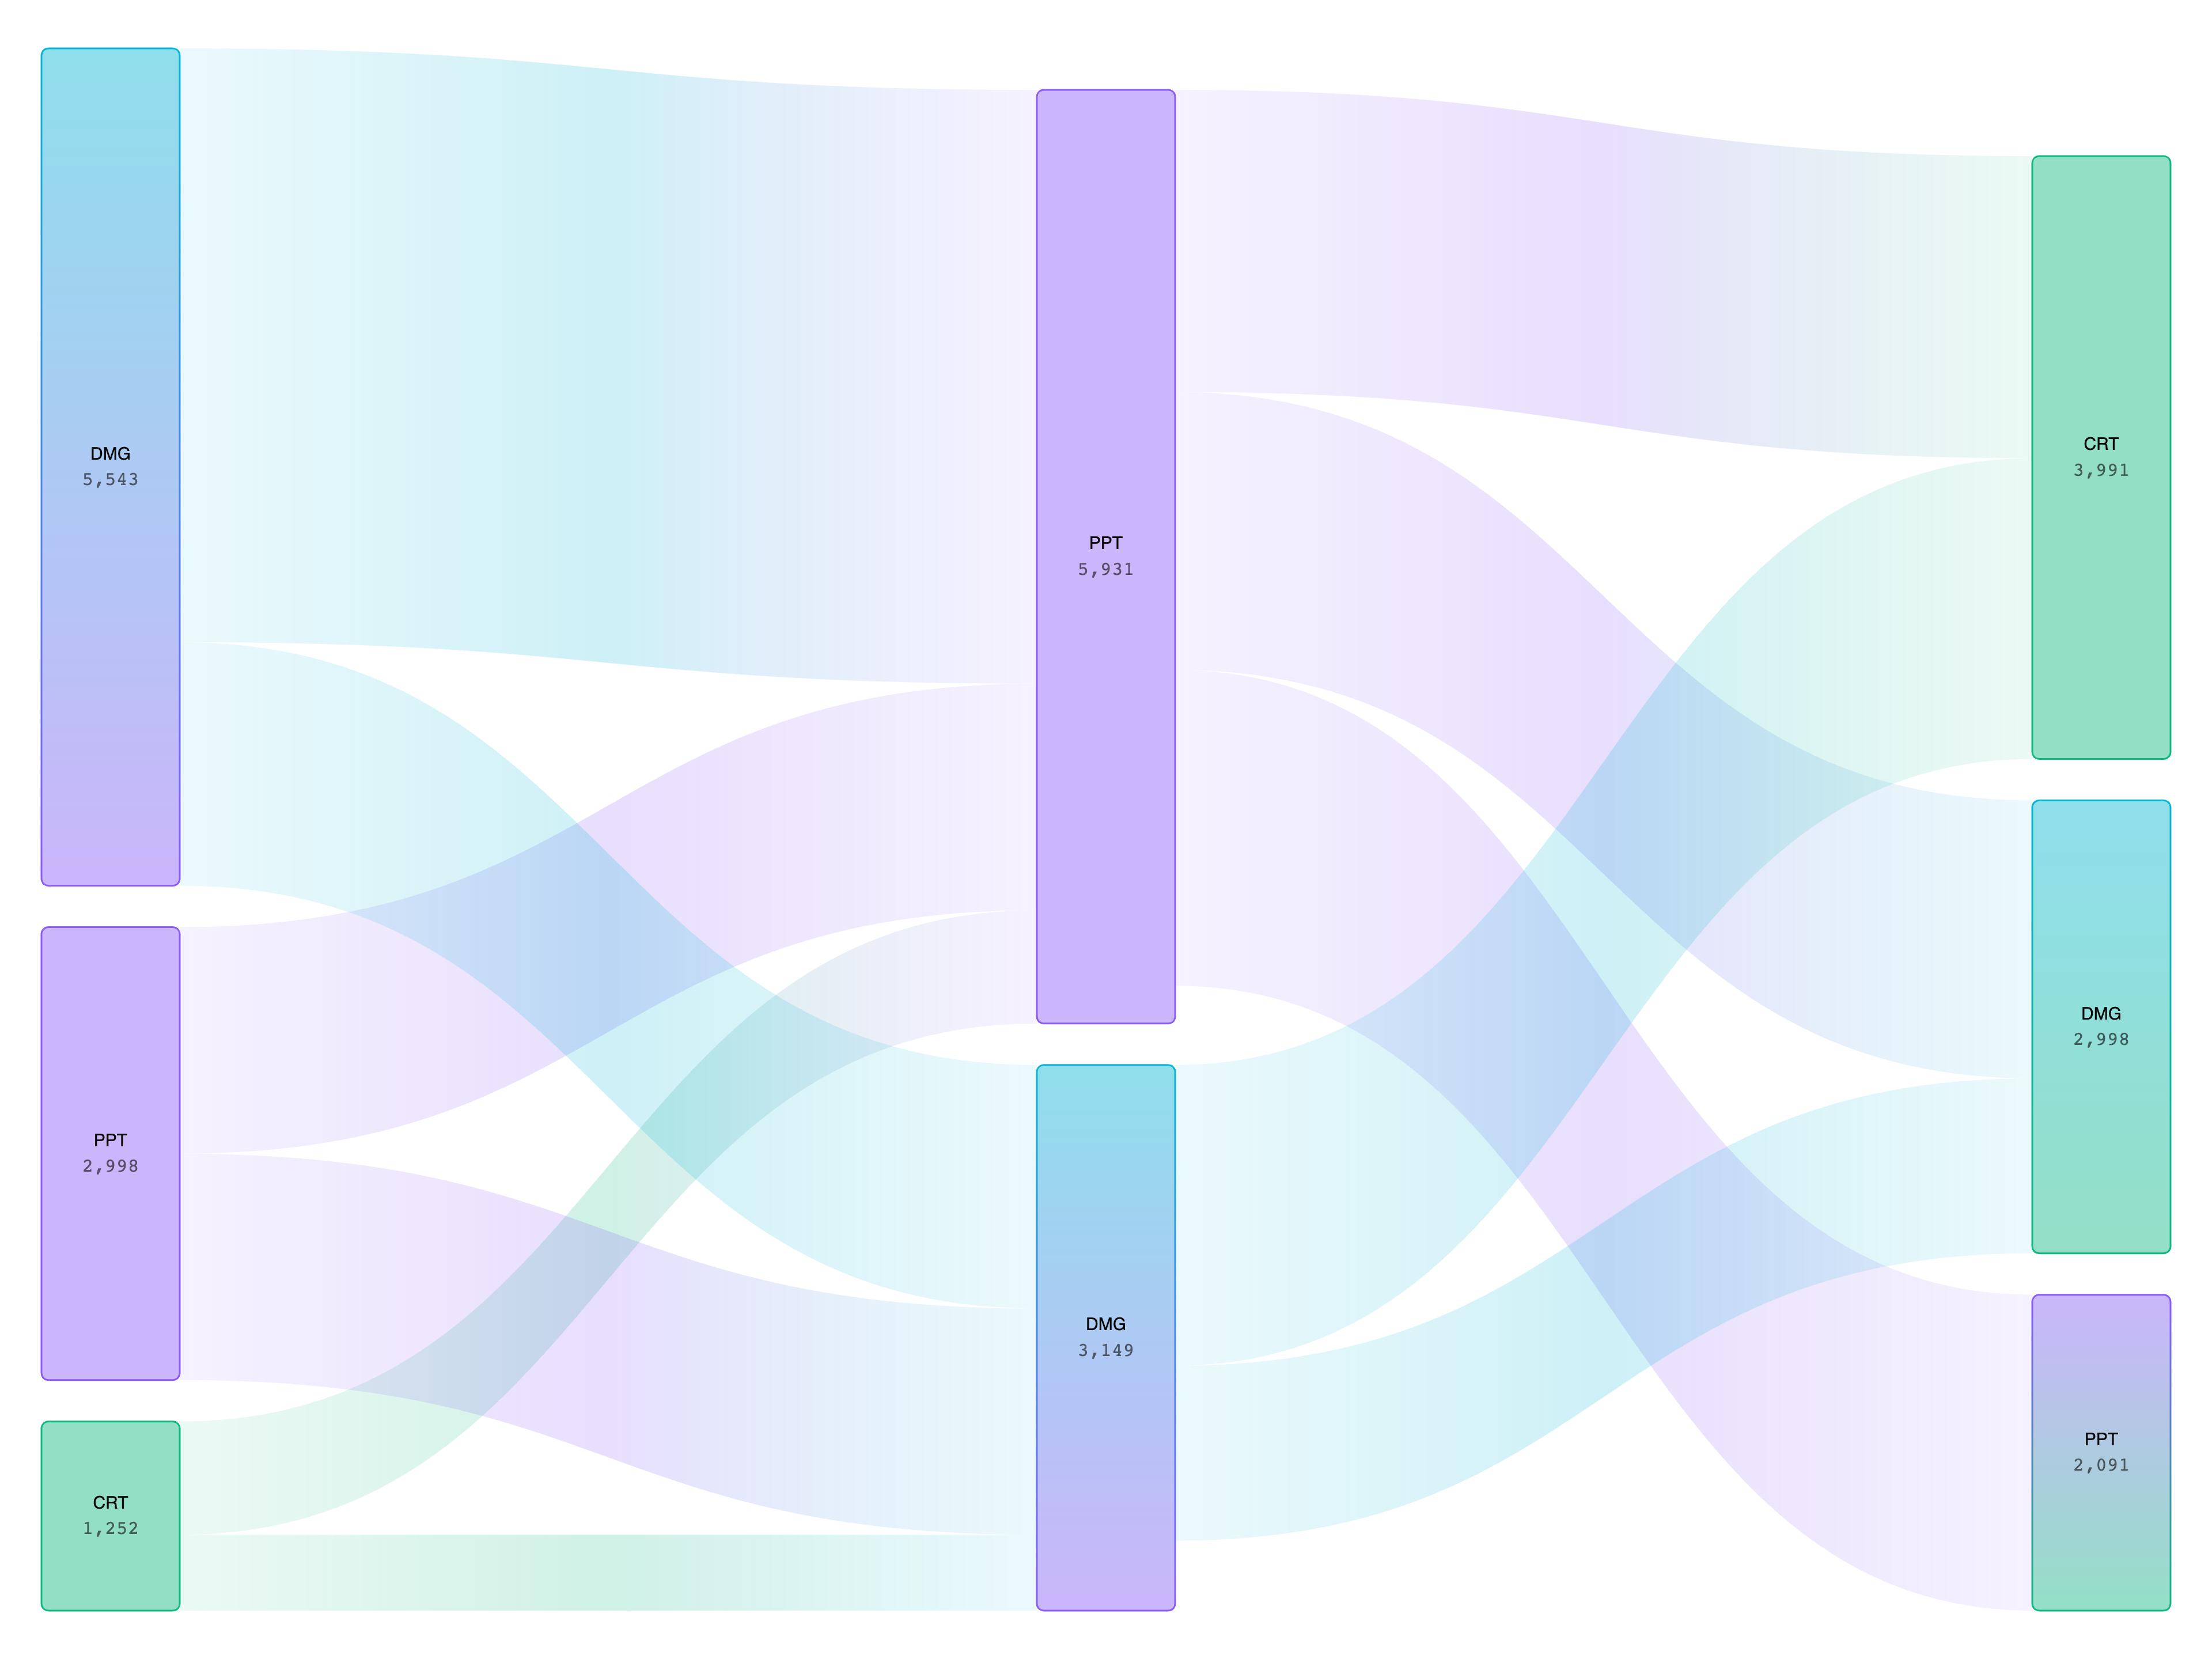
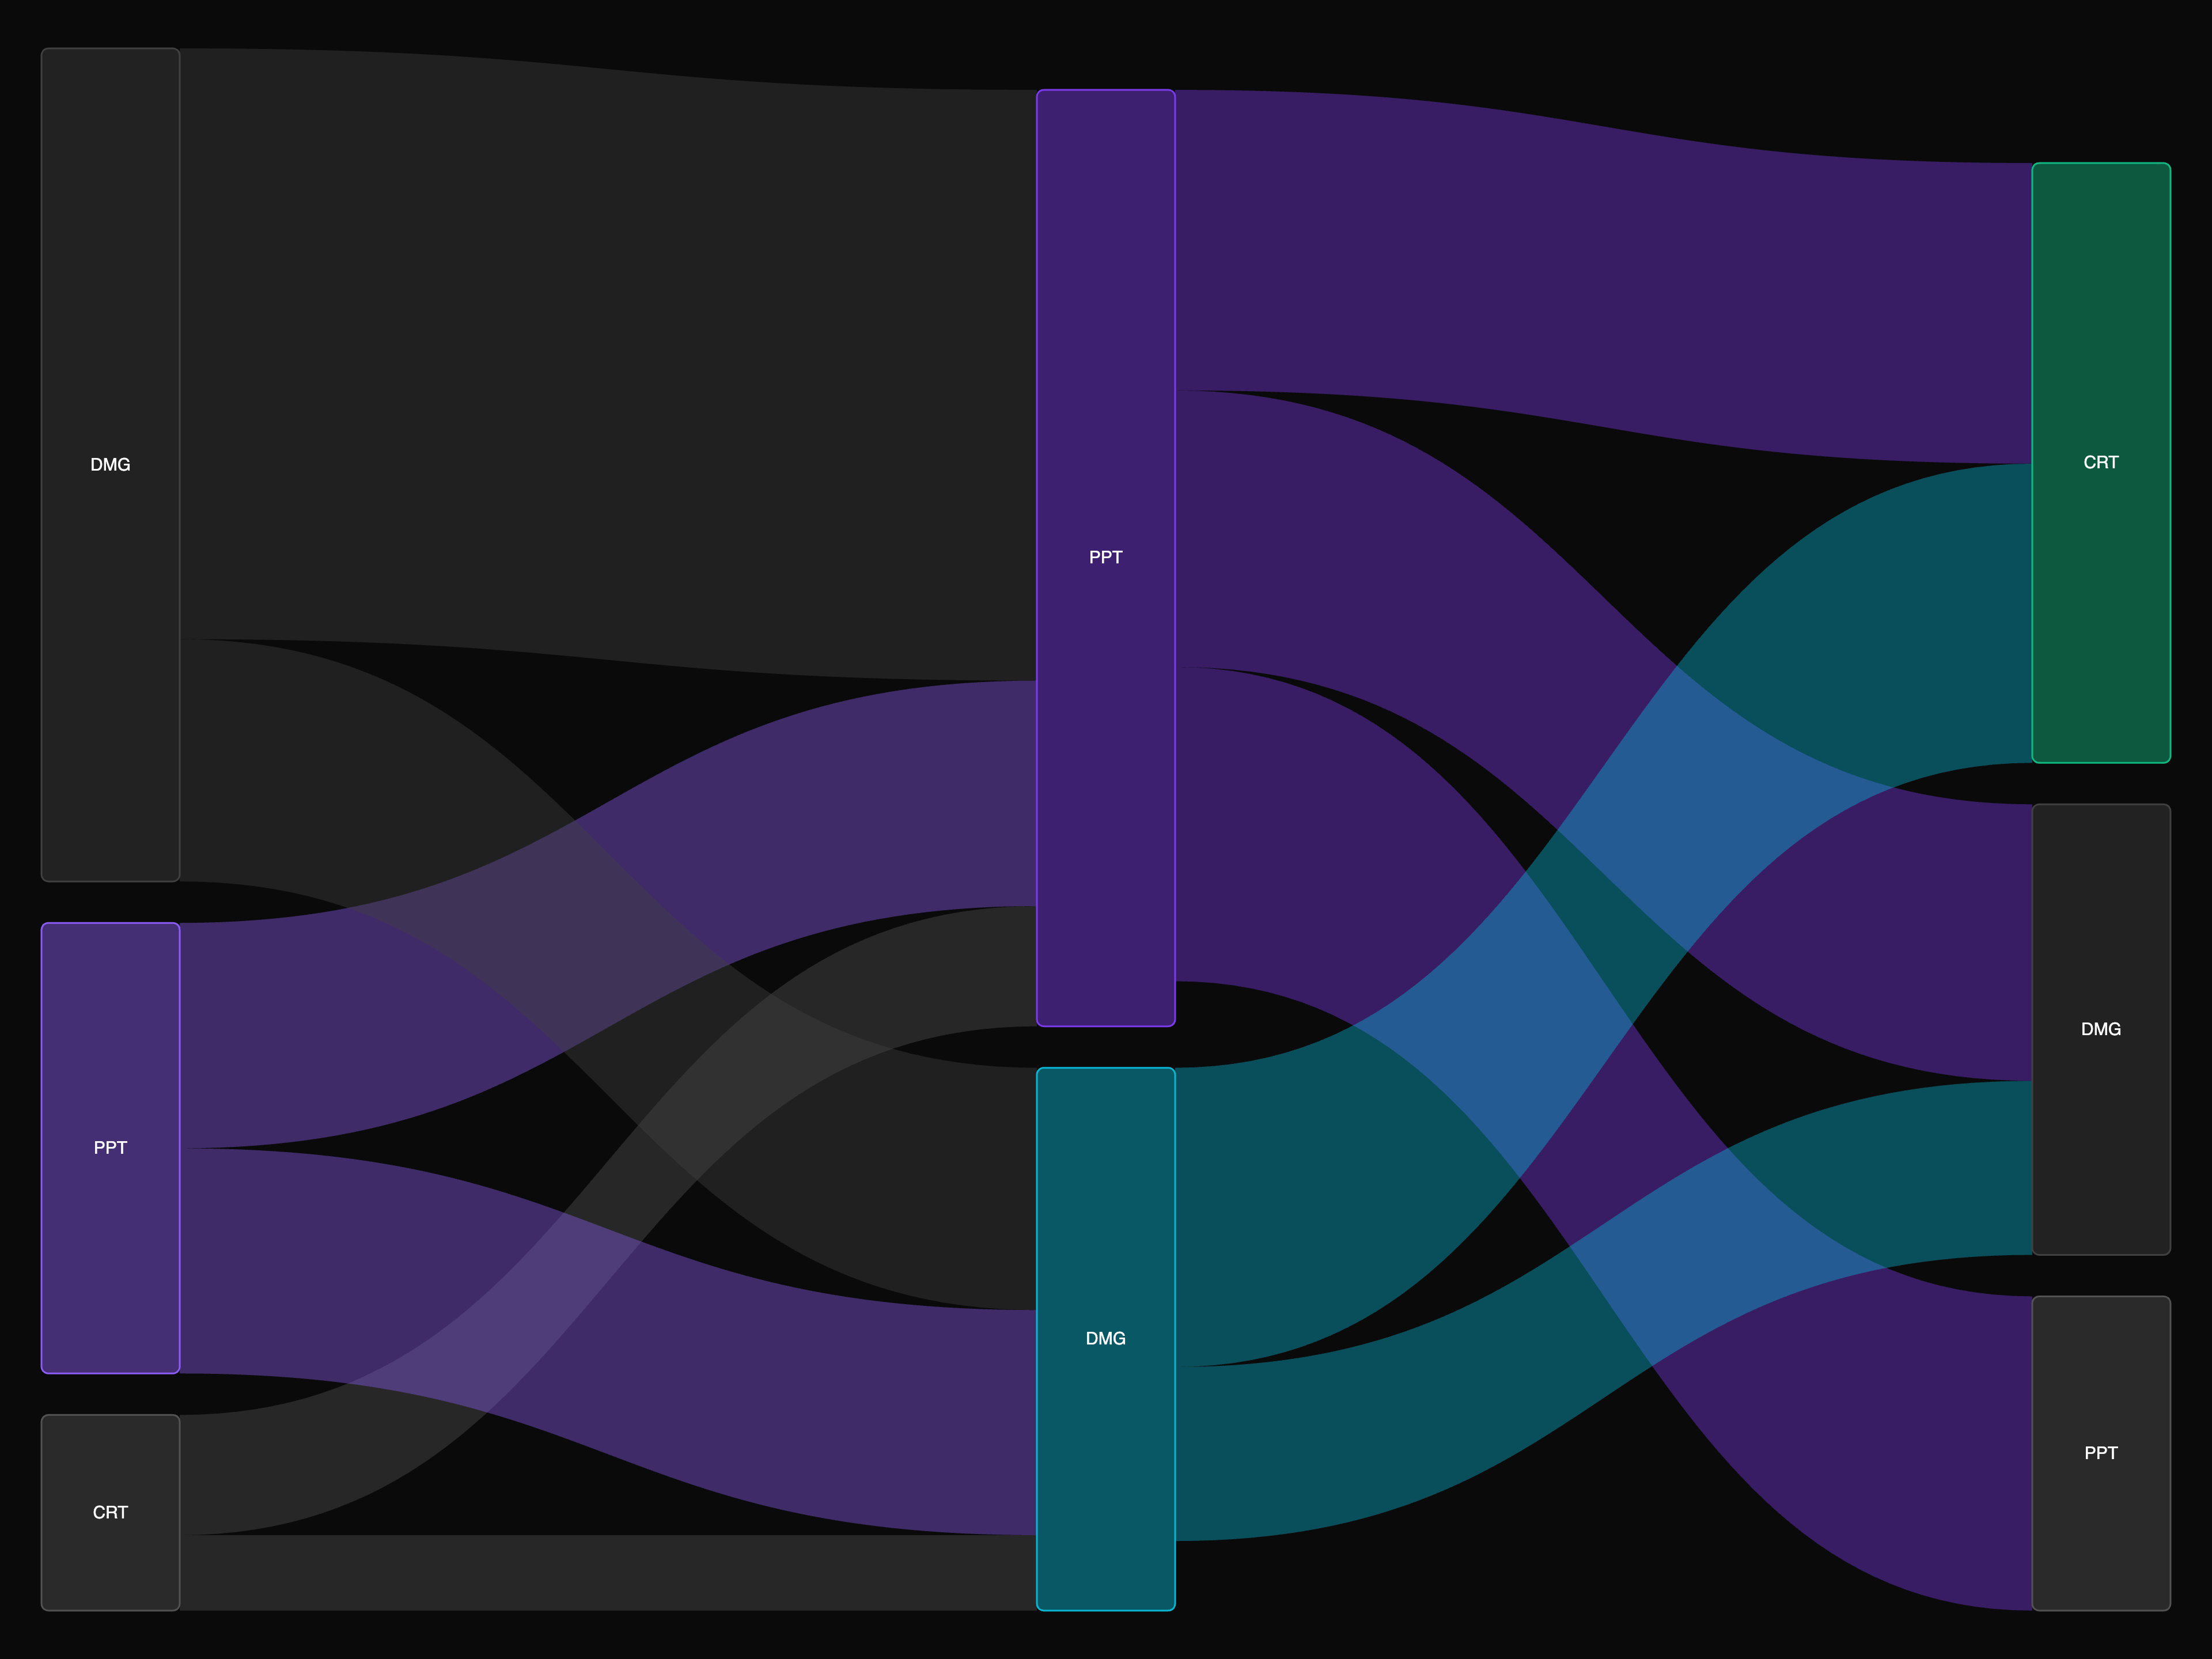
  • ECharts Sankey ChartECharts Sankey Chart

    ECharts Sankey Chart
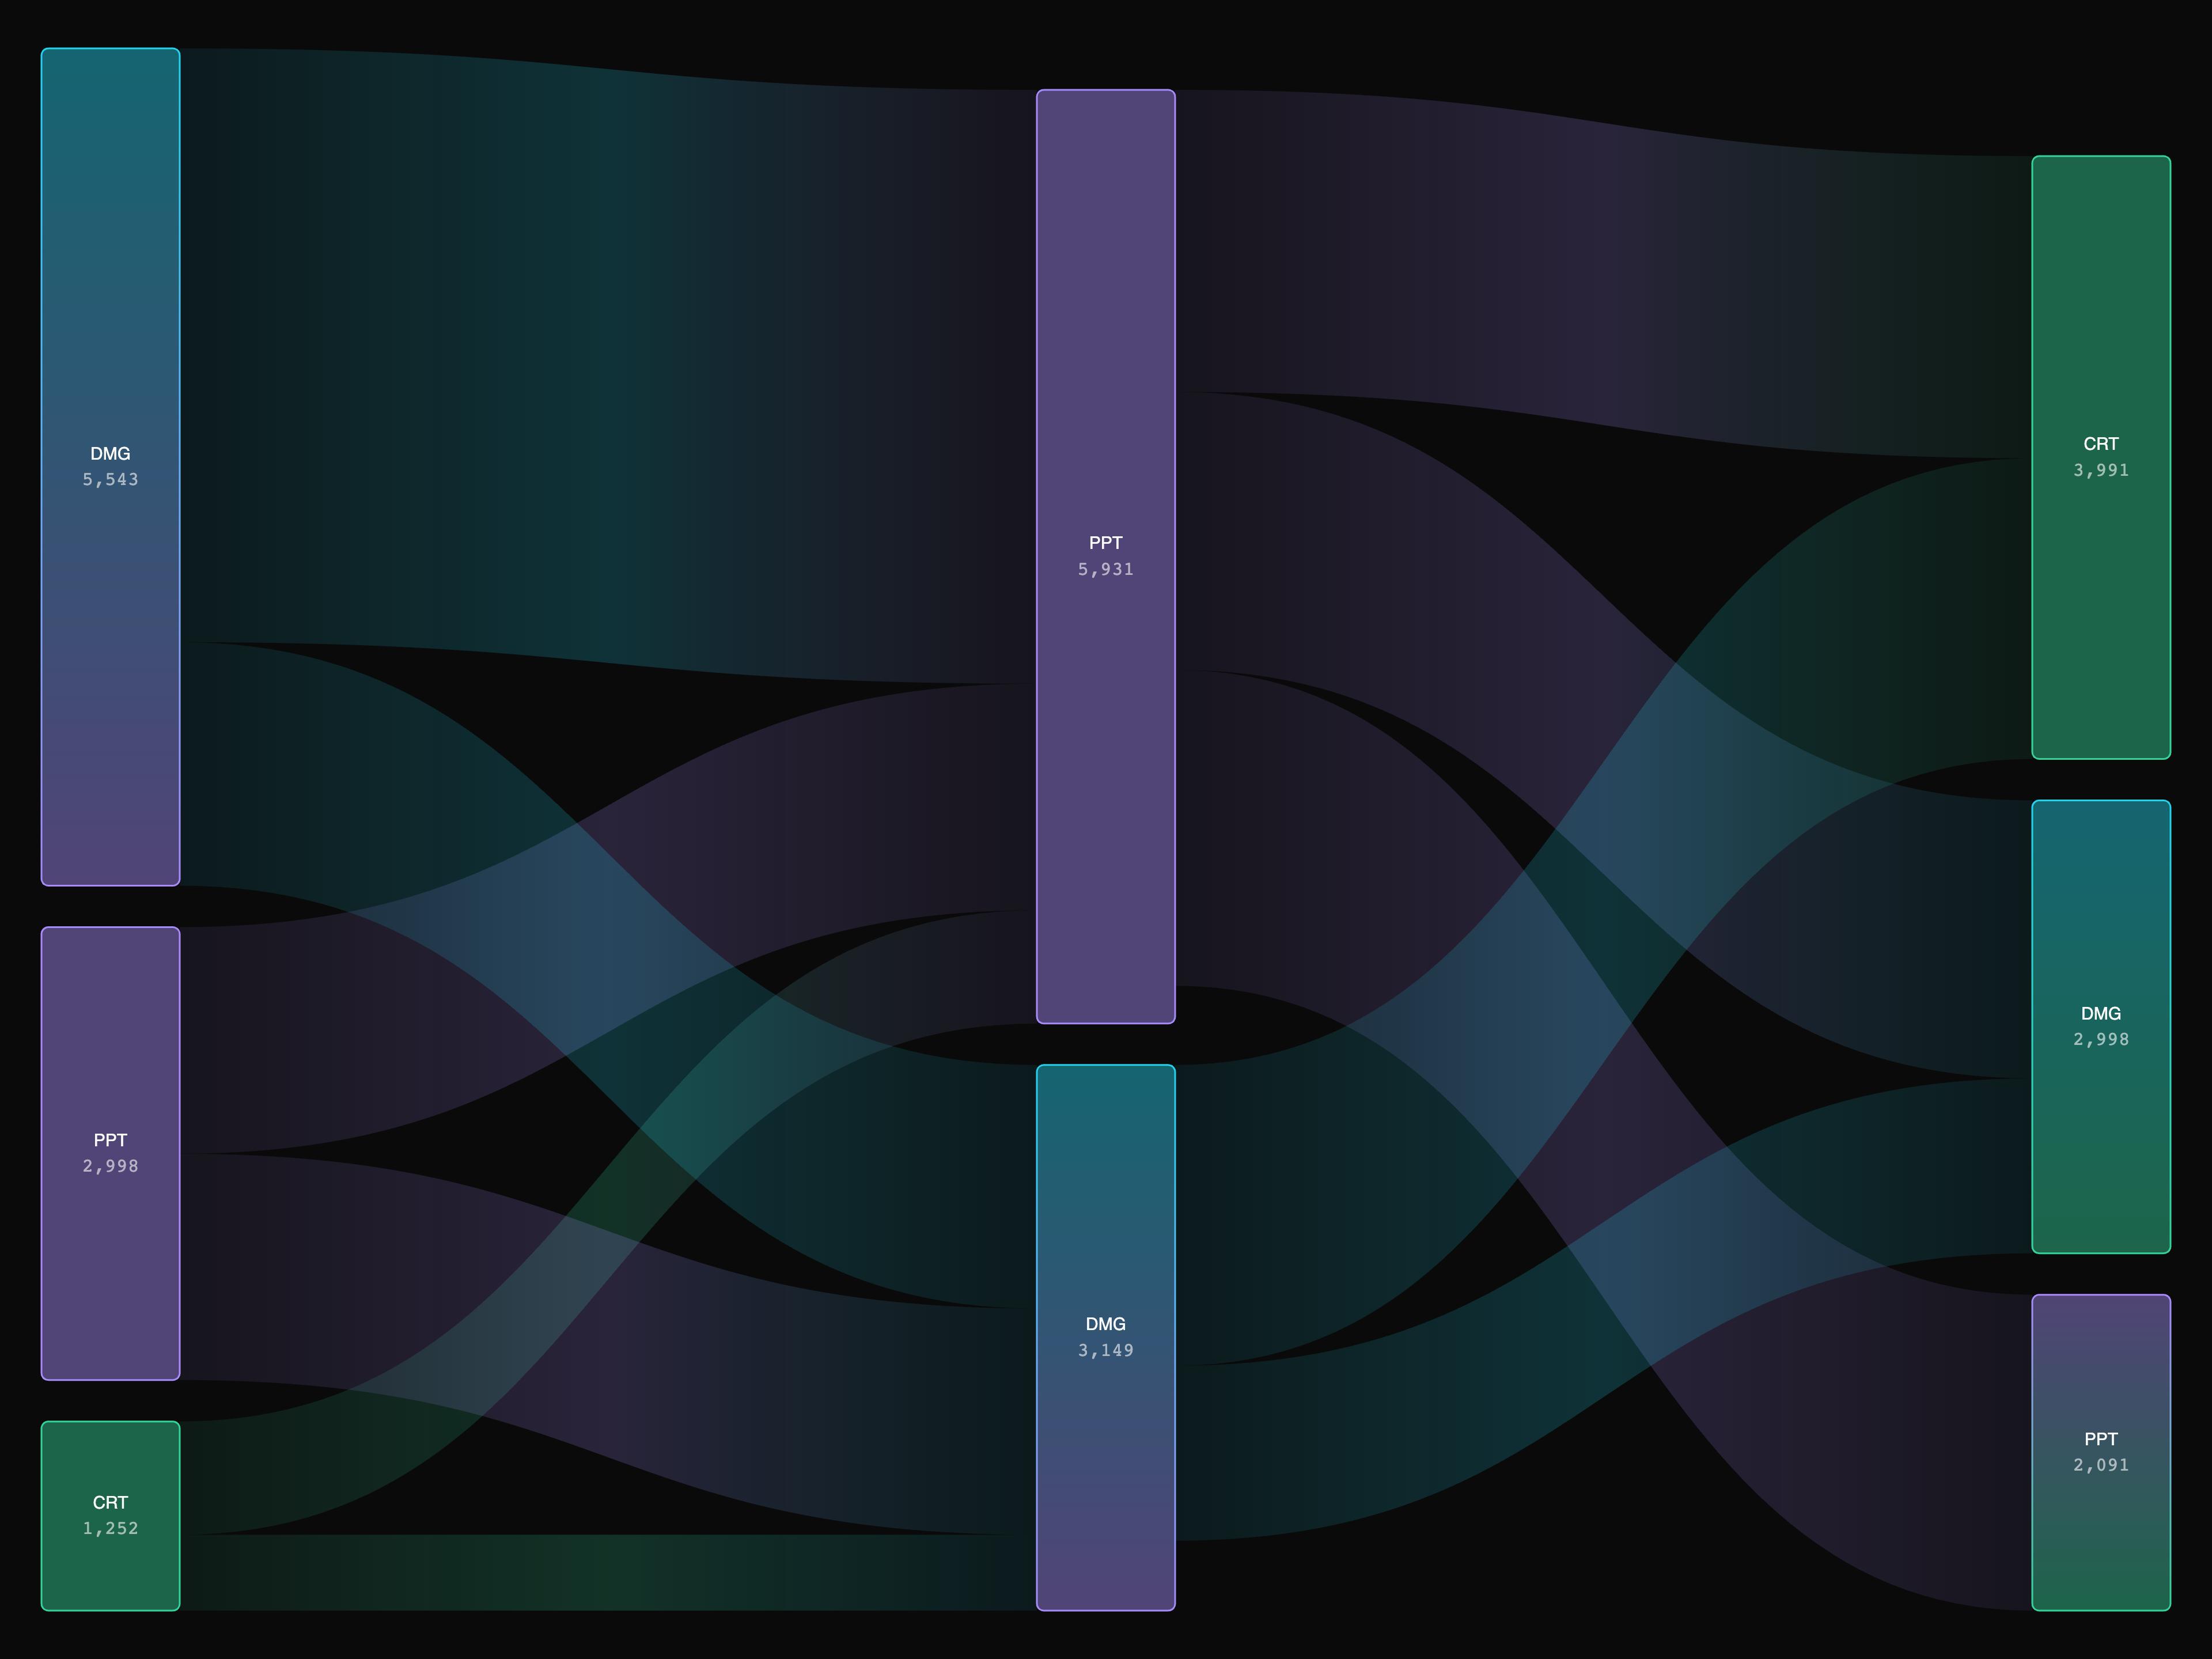
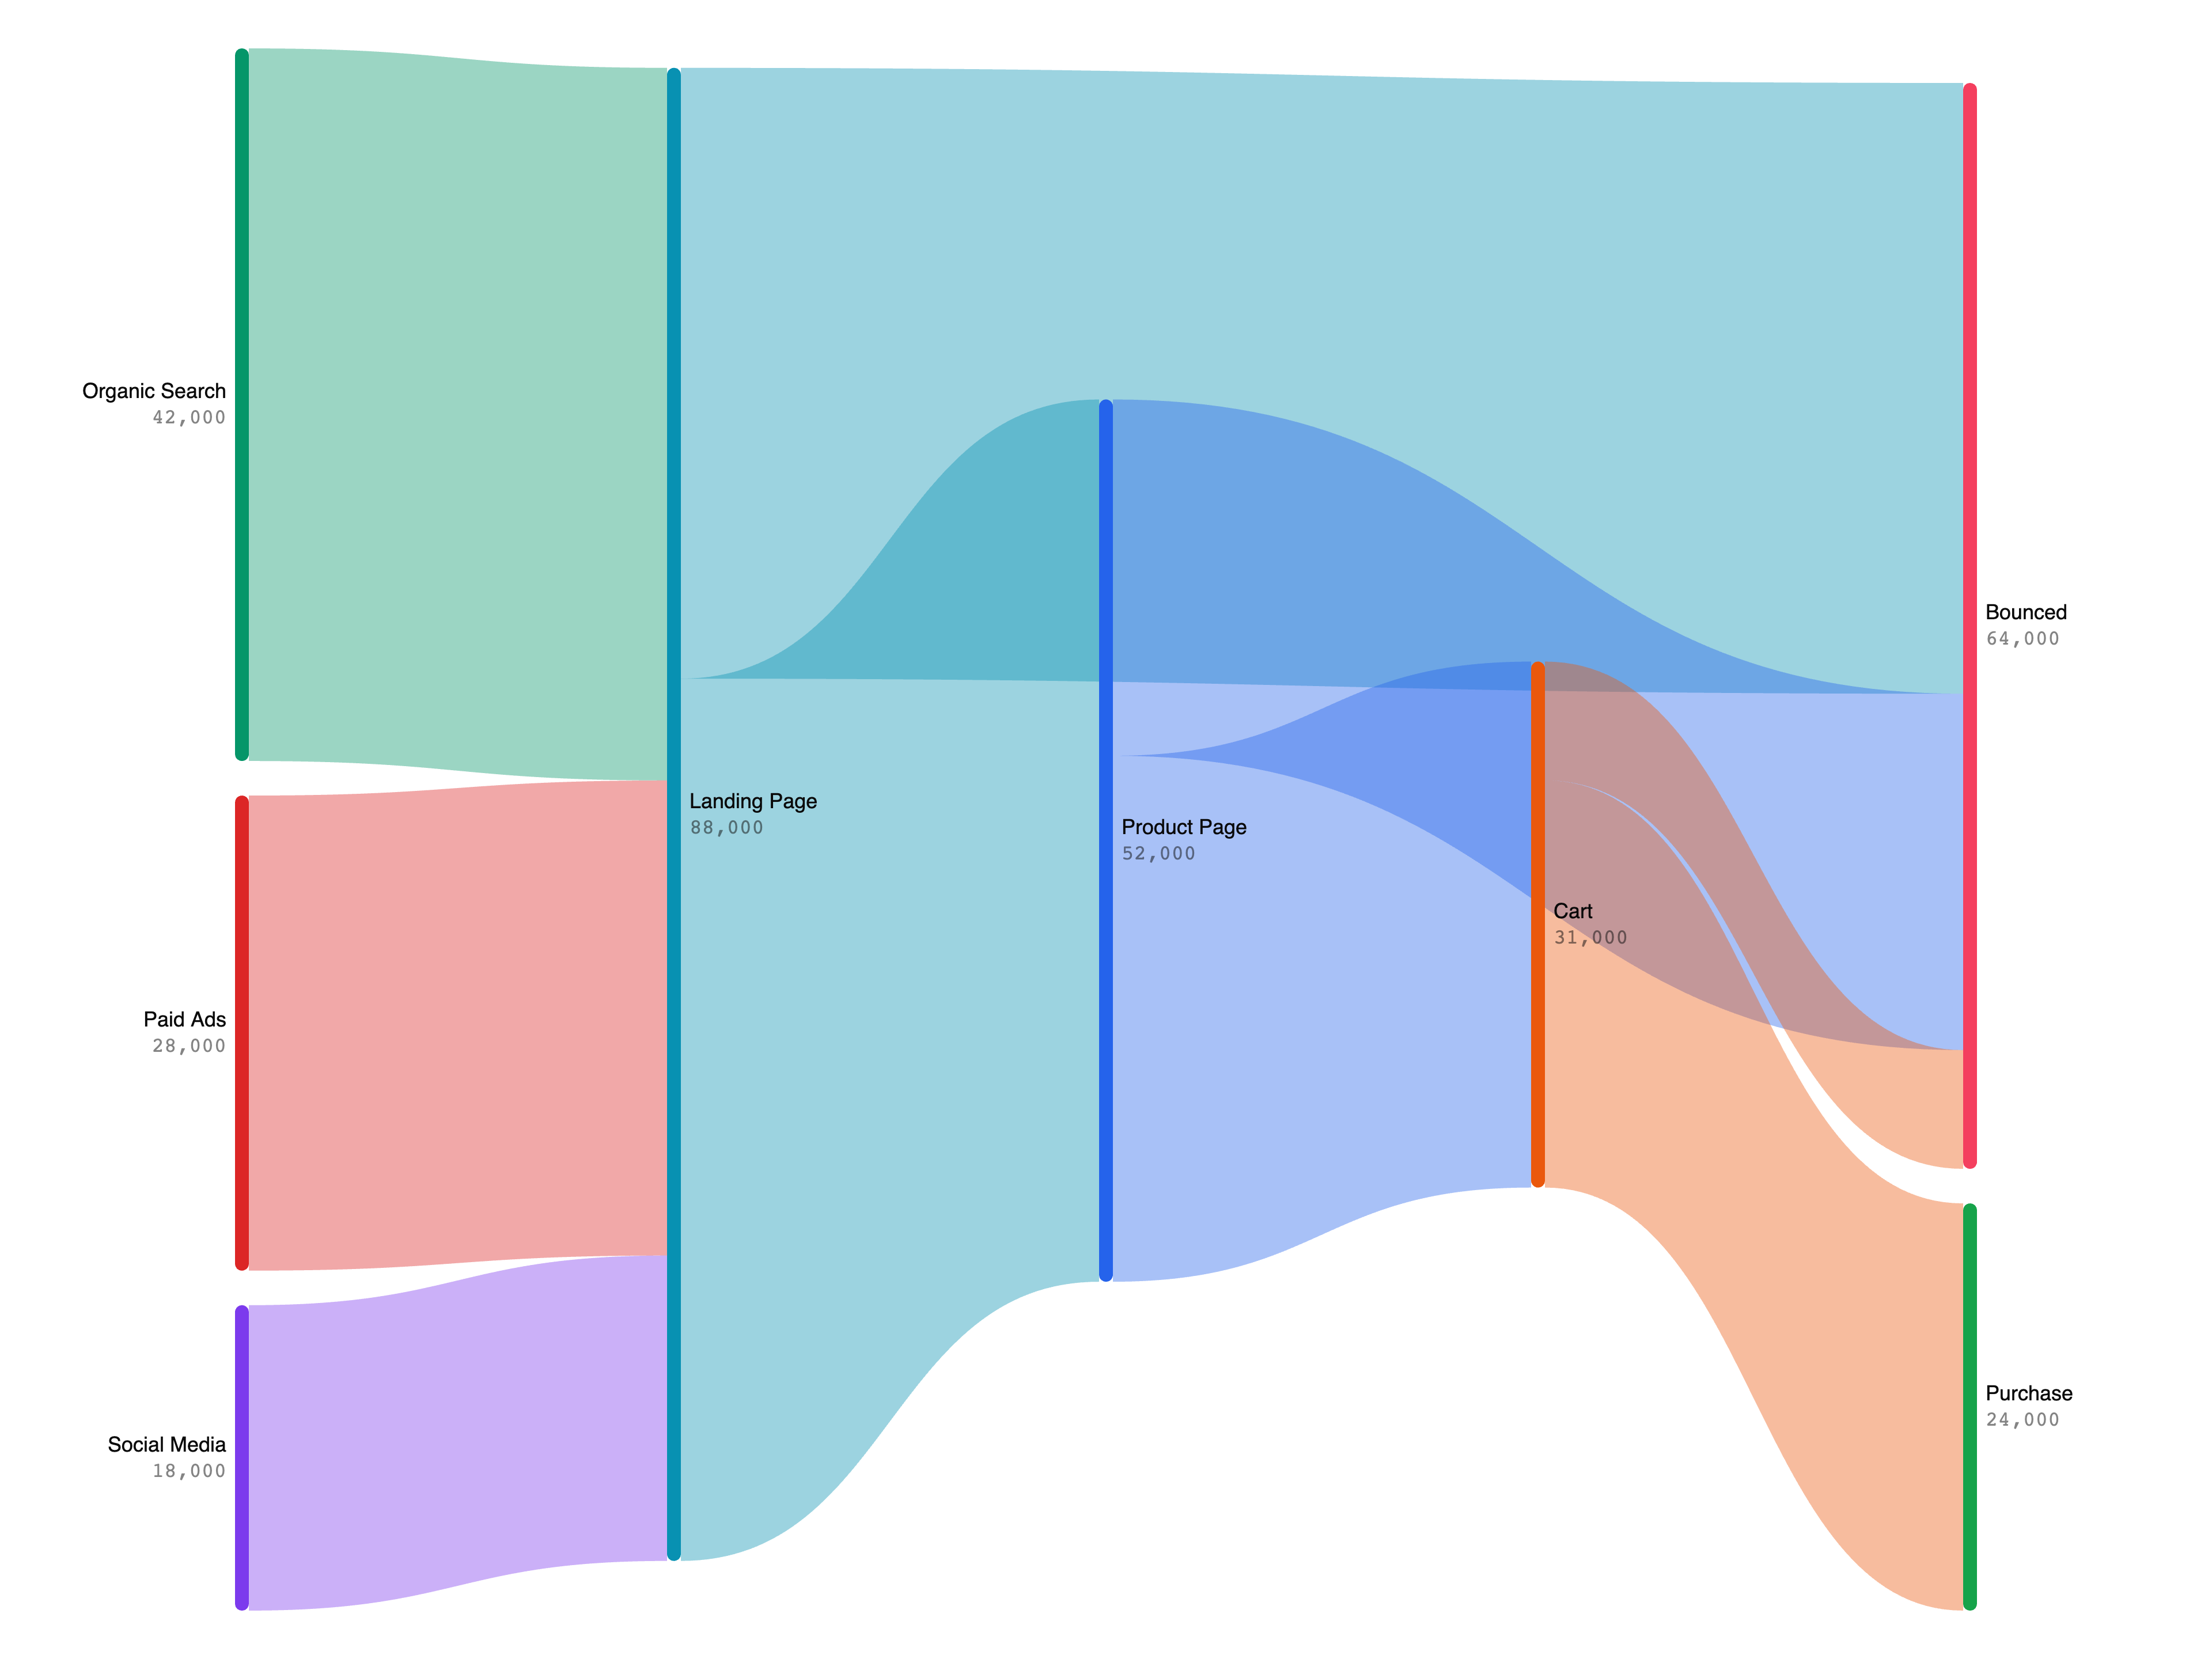
  • ECharts Sankey ChartECharts Sankey Chart

    ECharts Sankey Chart
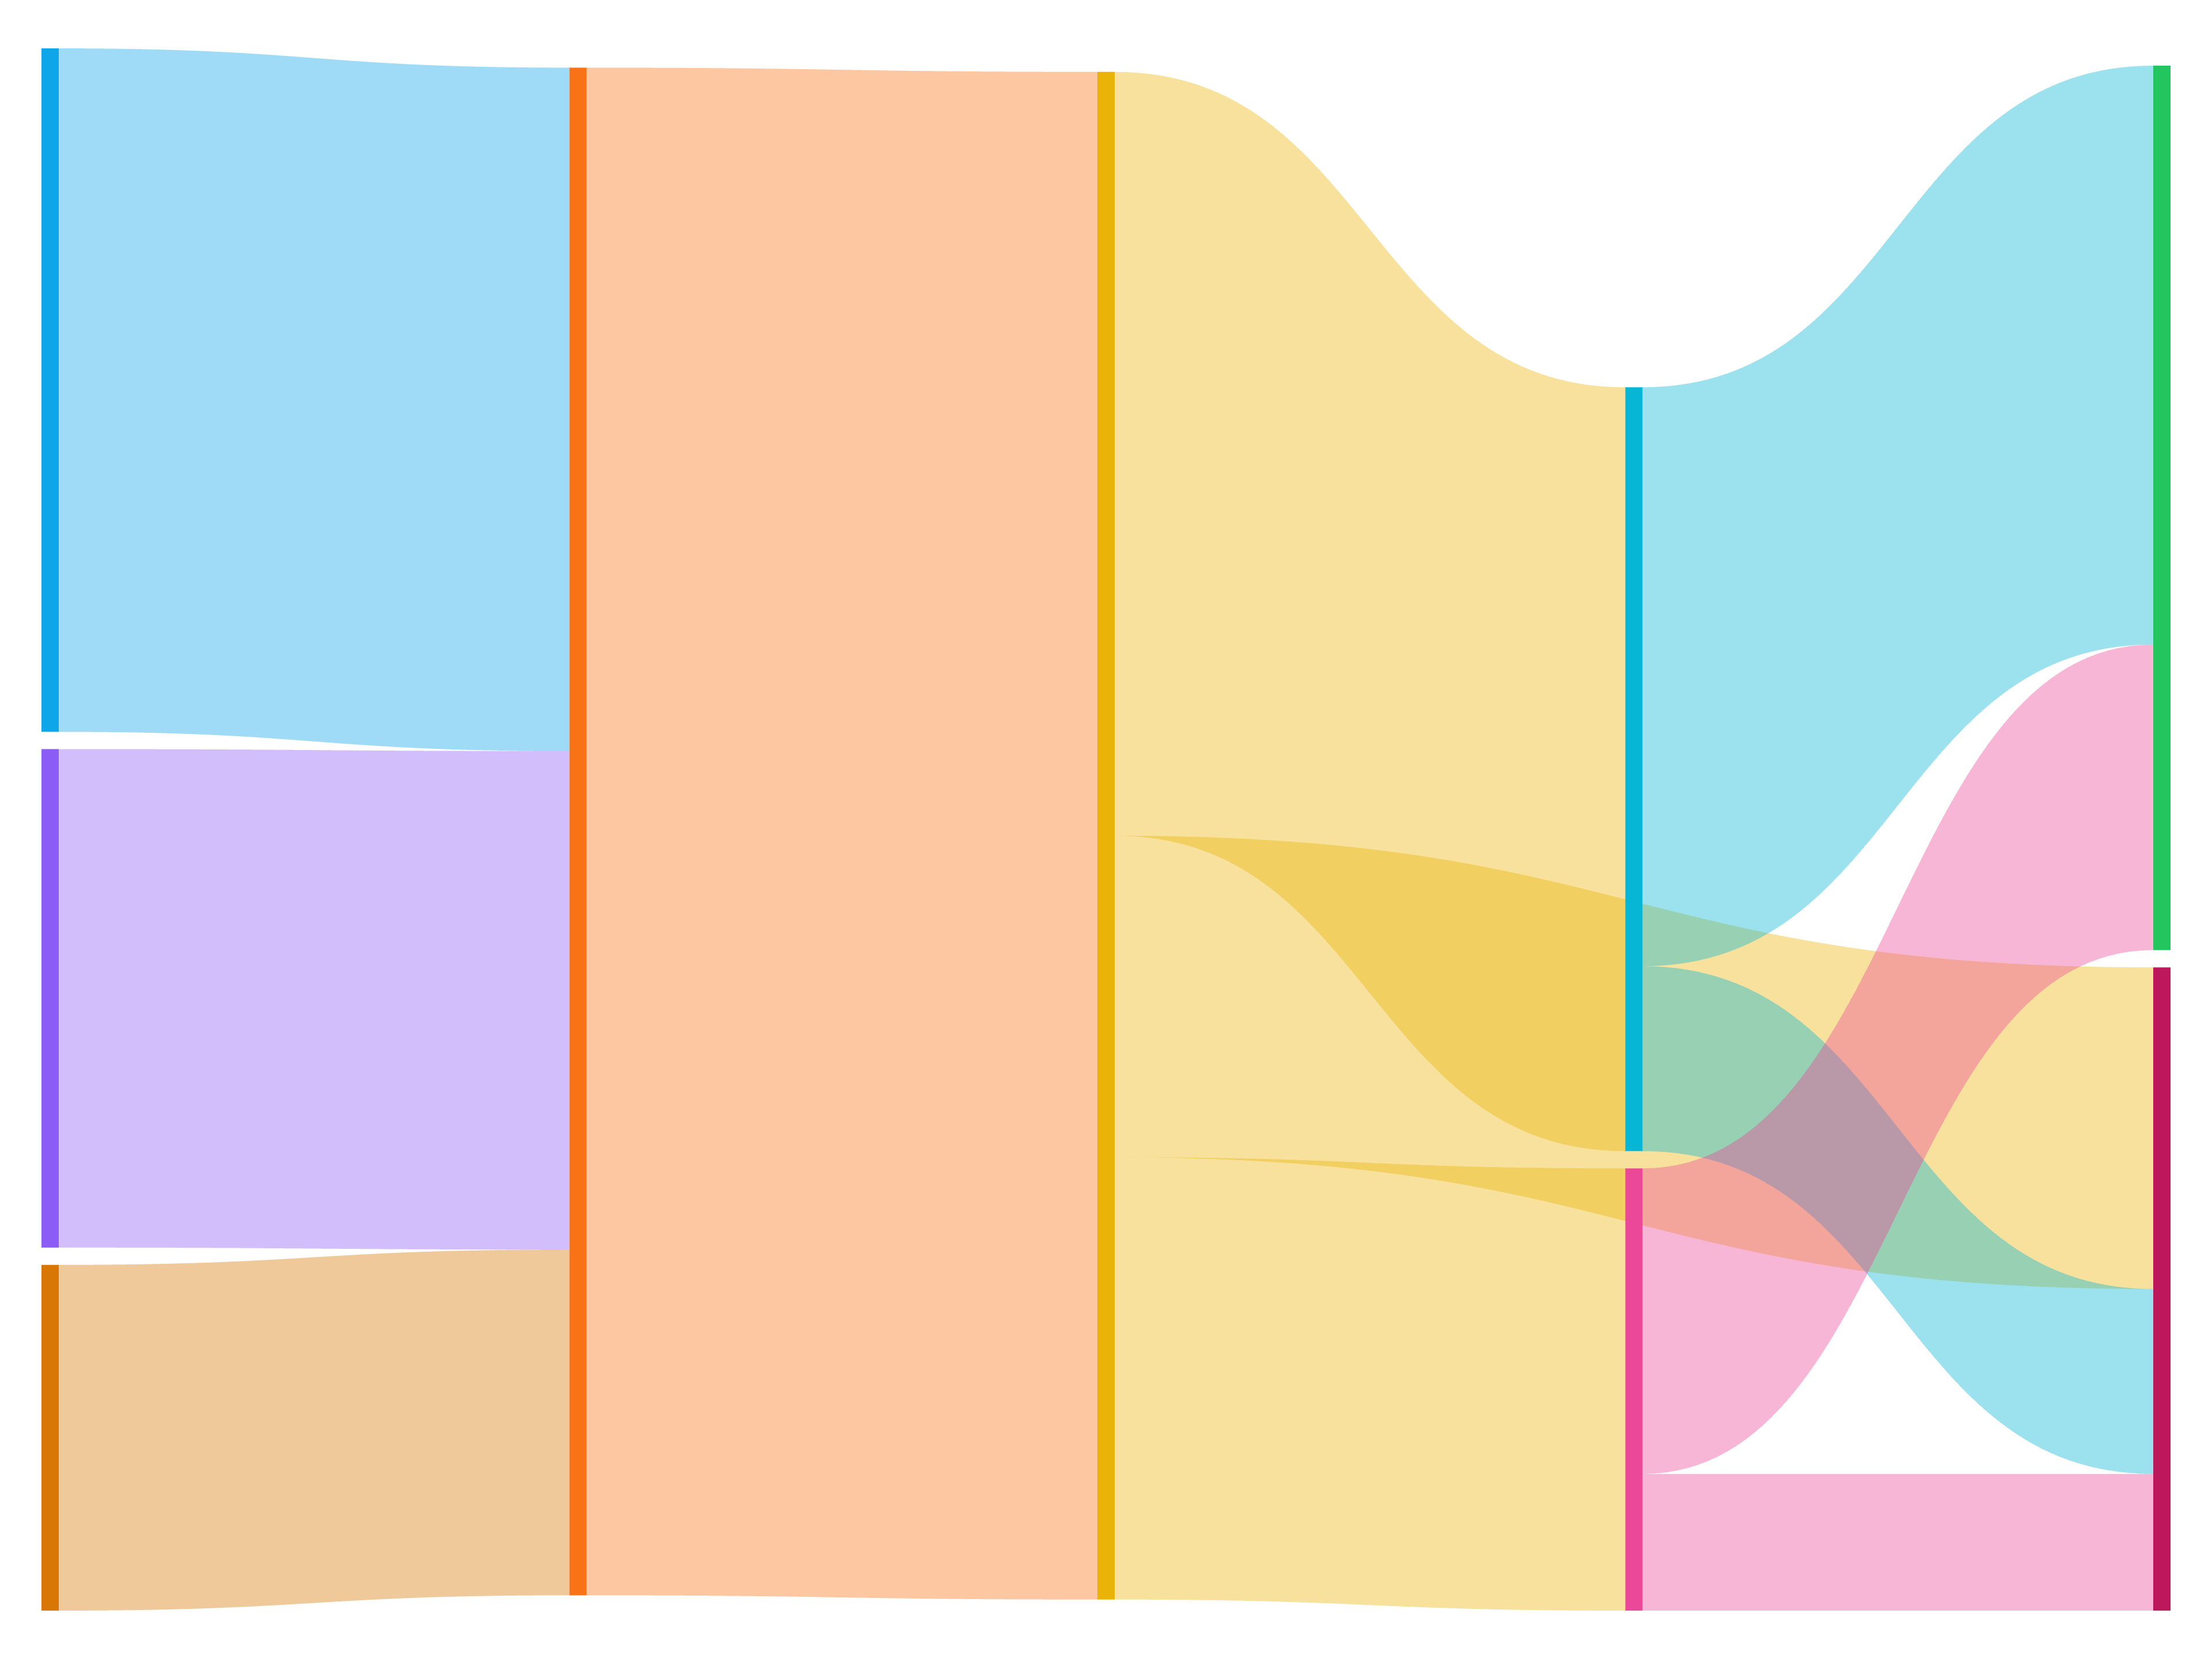
  • ECharts Sankey ChartECharts Sankey Chart

    ECharts Sankey Chart
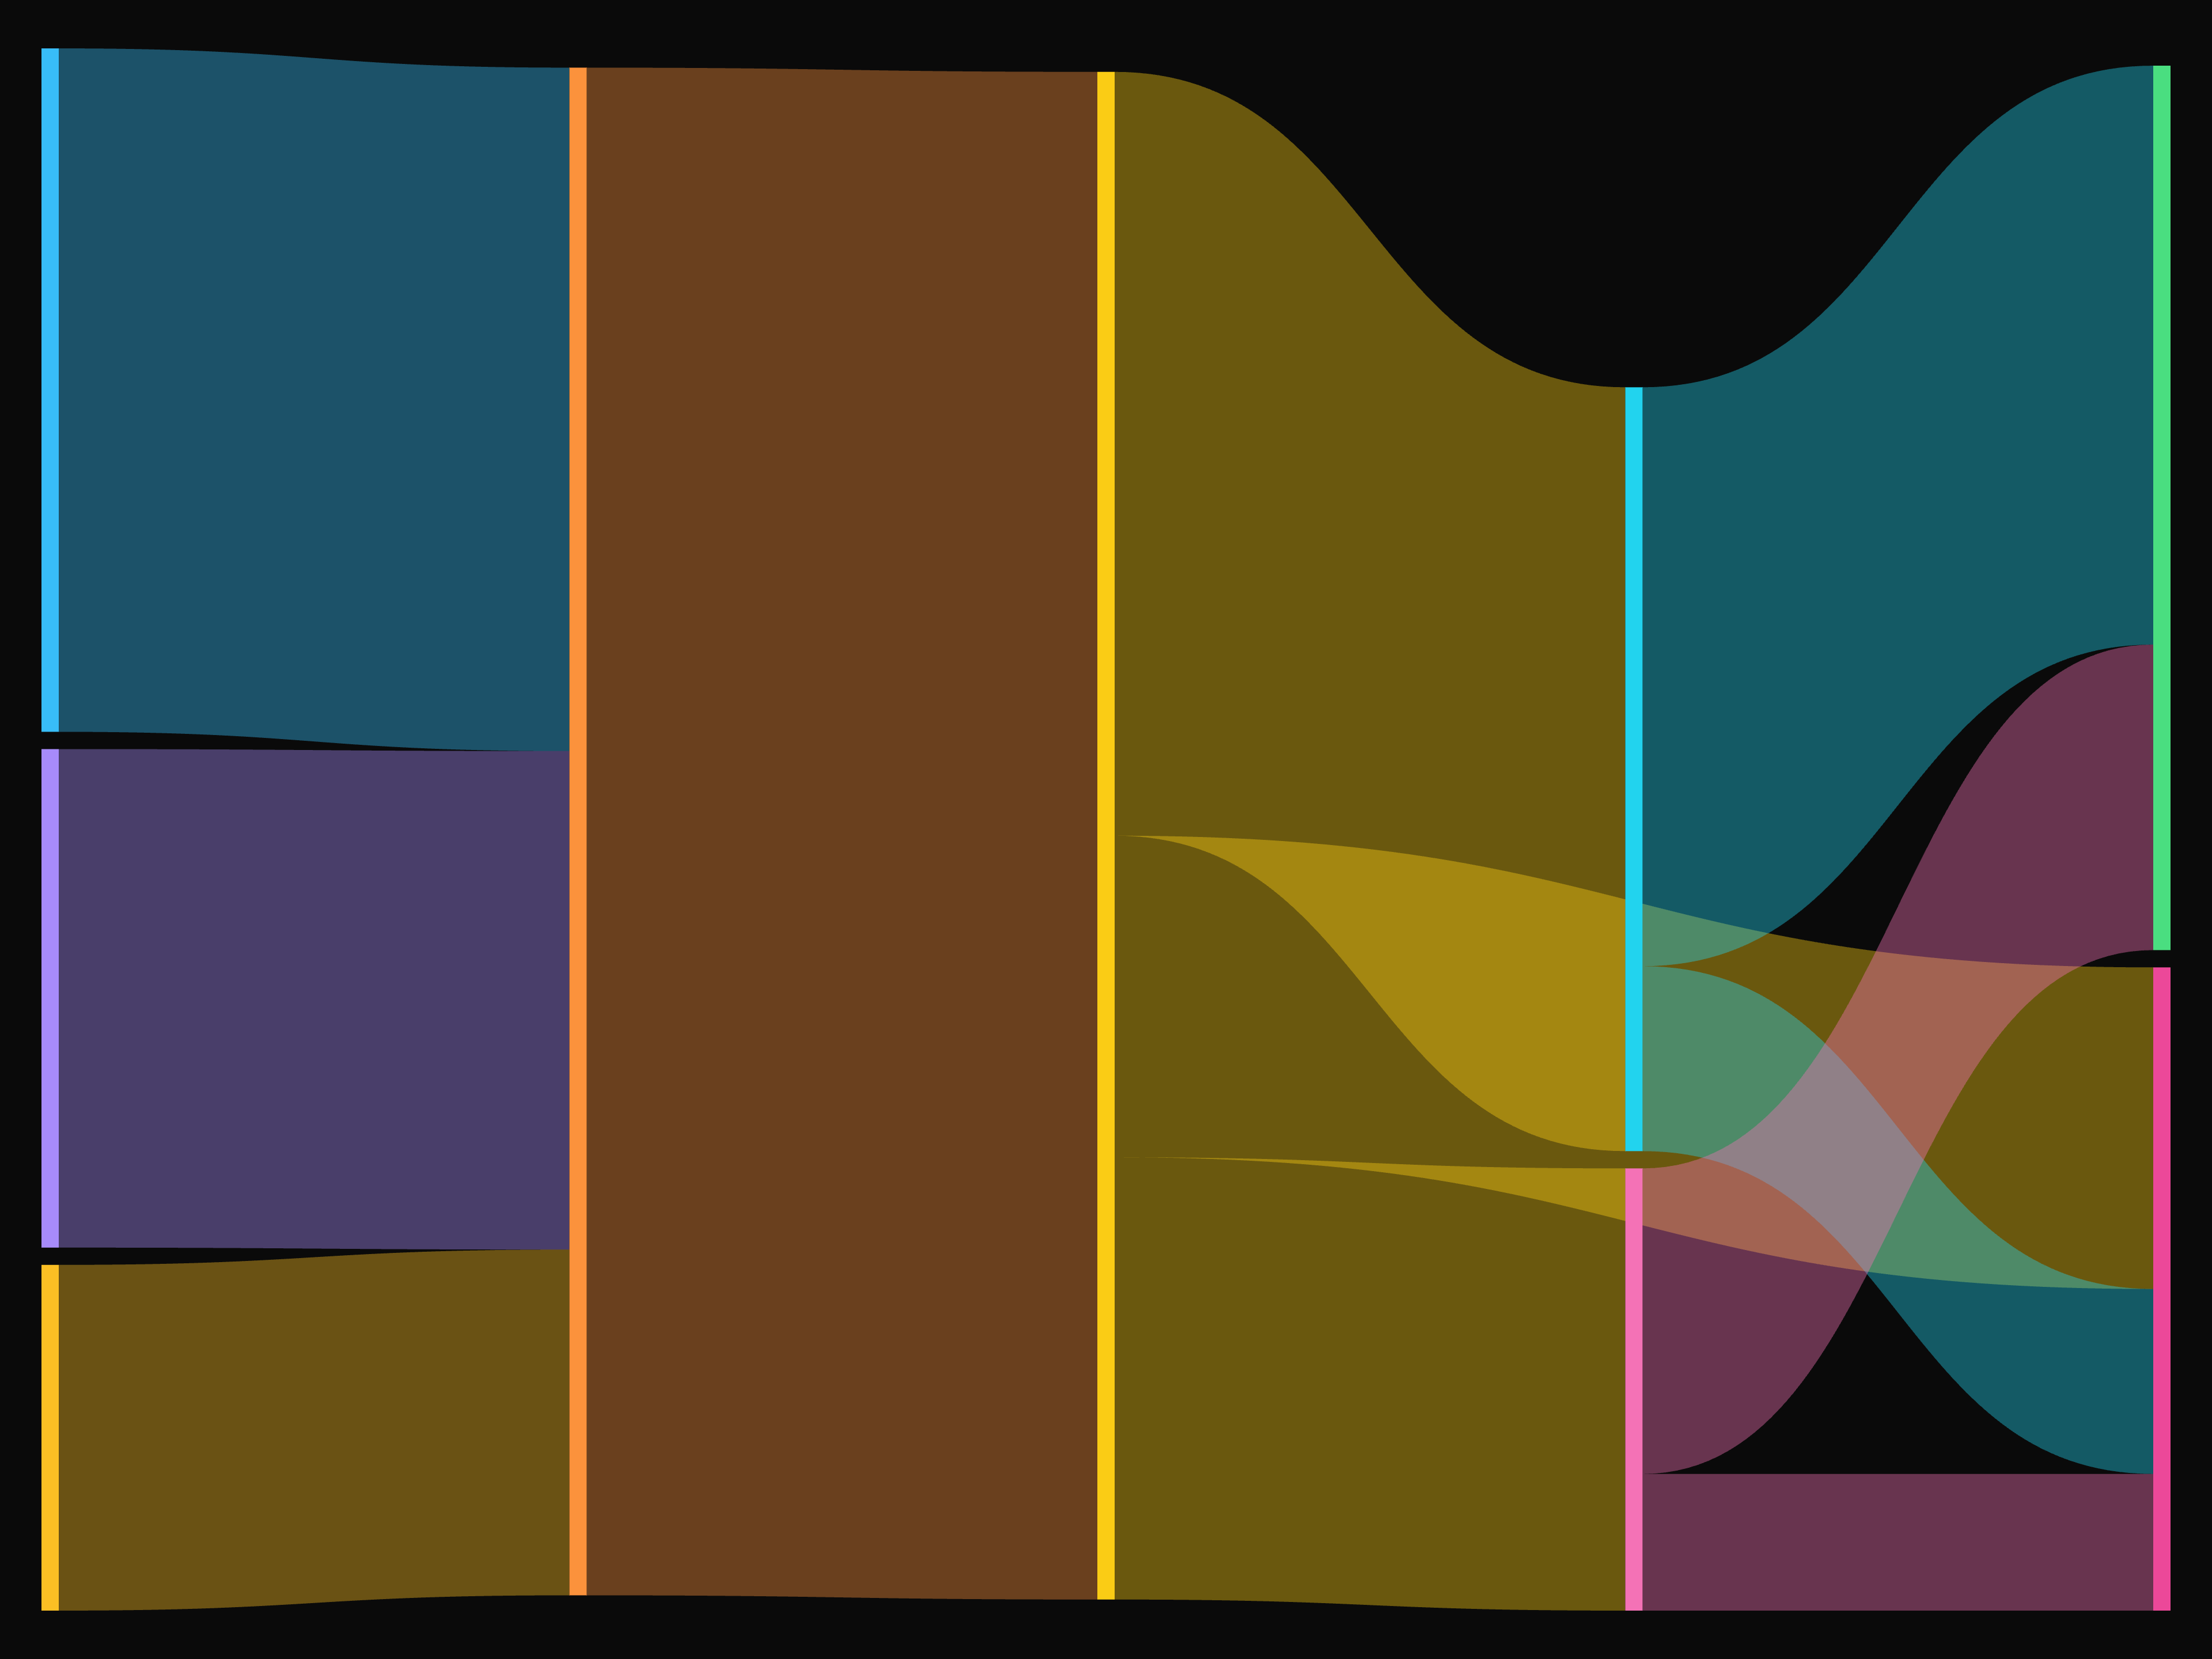
  • ECharts Sankey ChartECharts Sankey Chart

    ECharts Sankey Chart
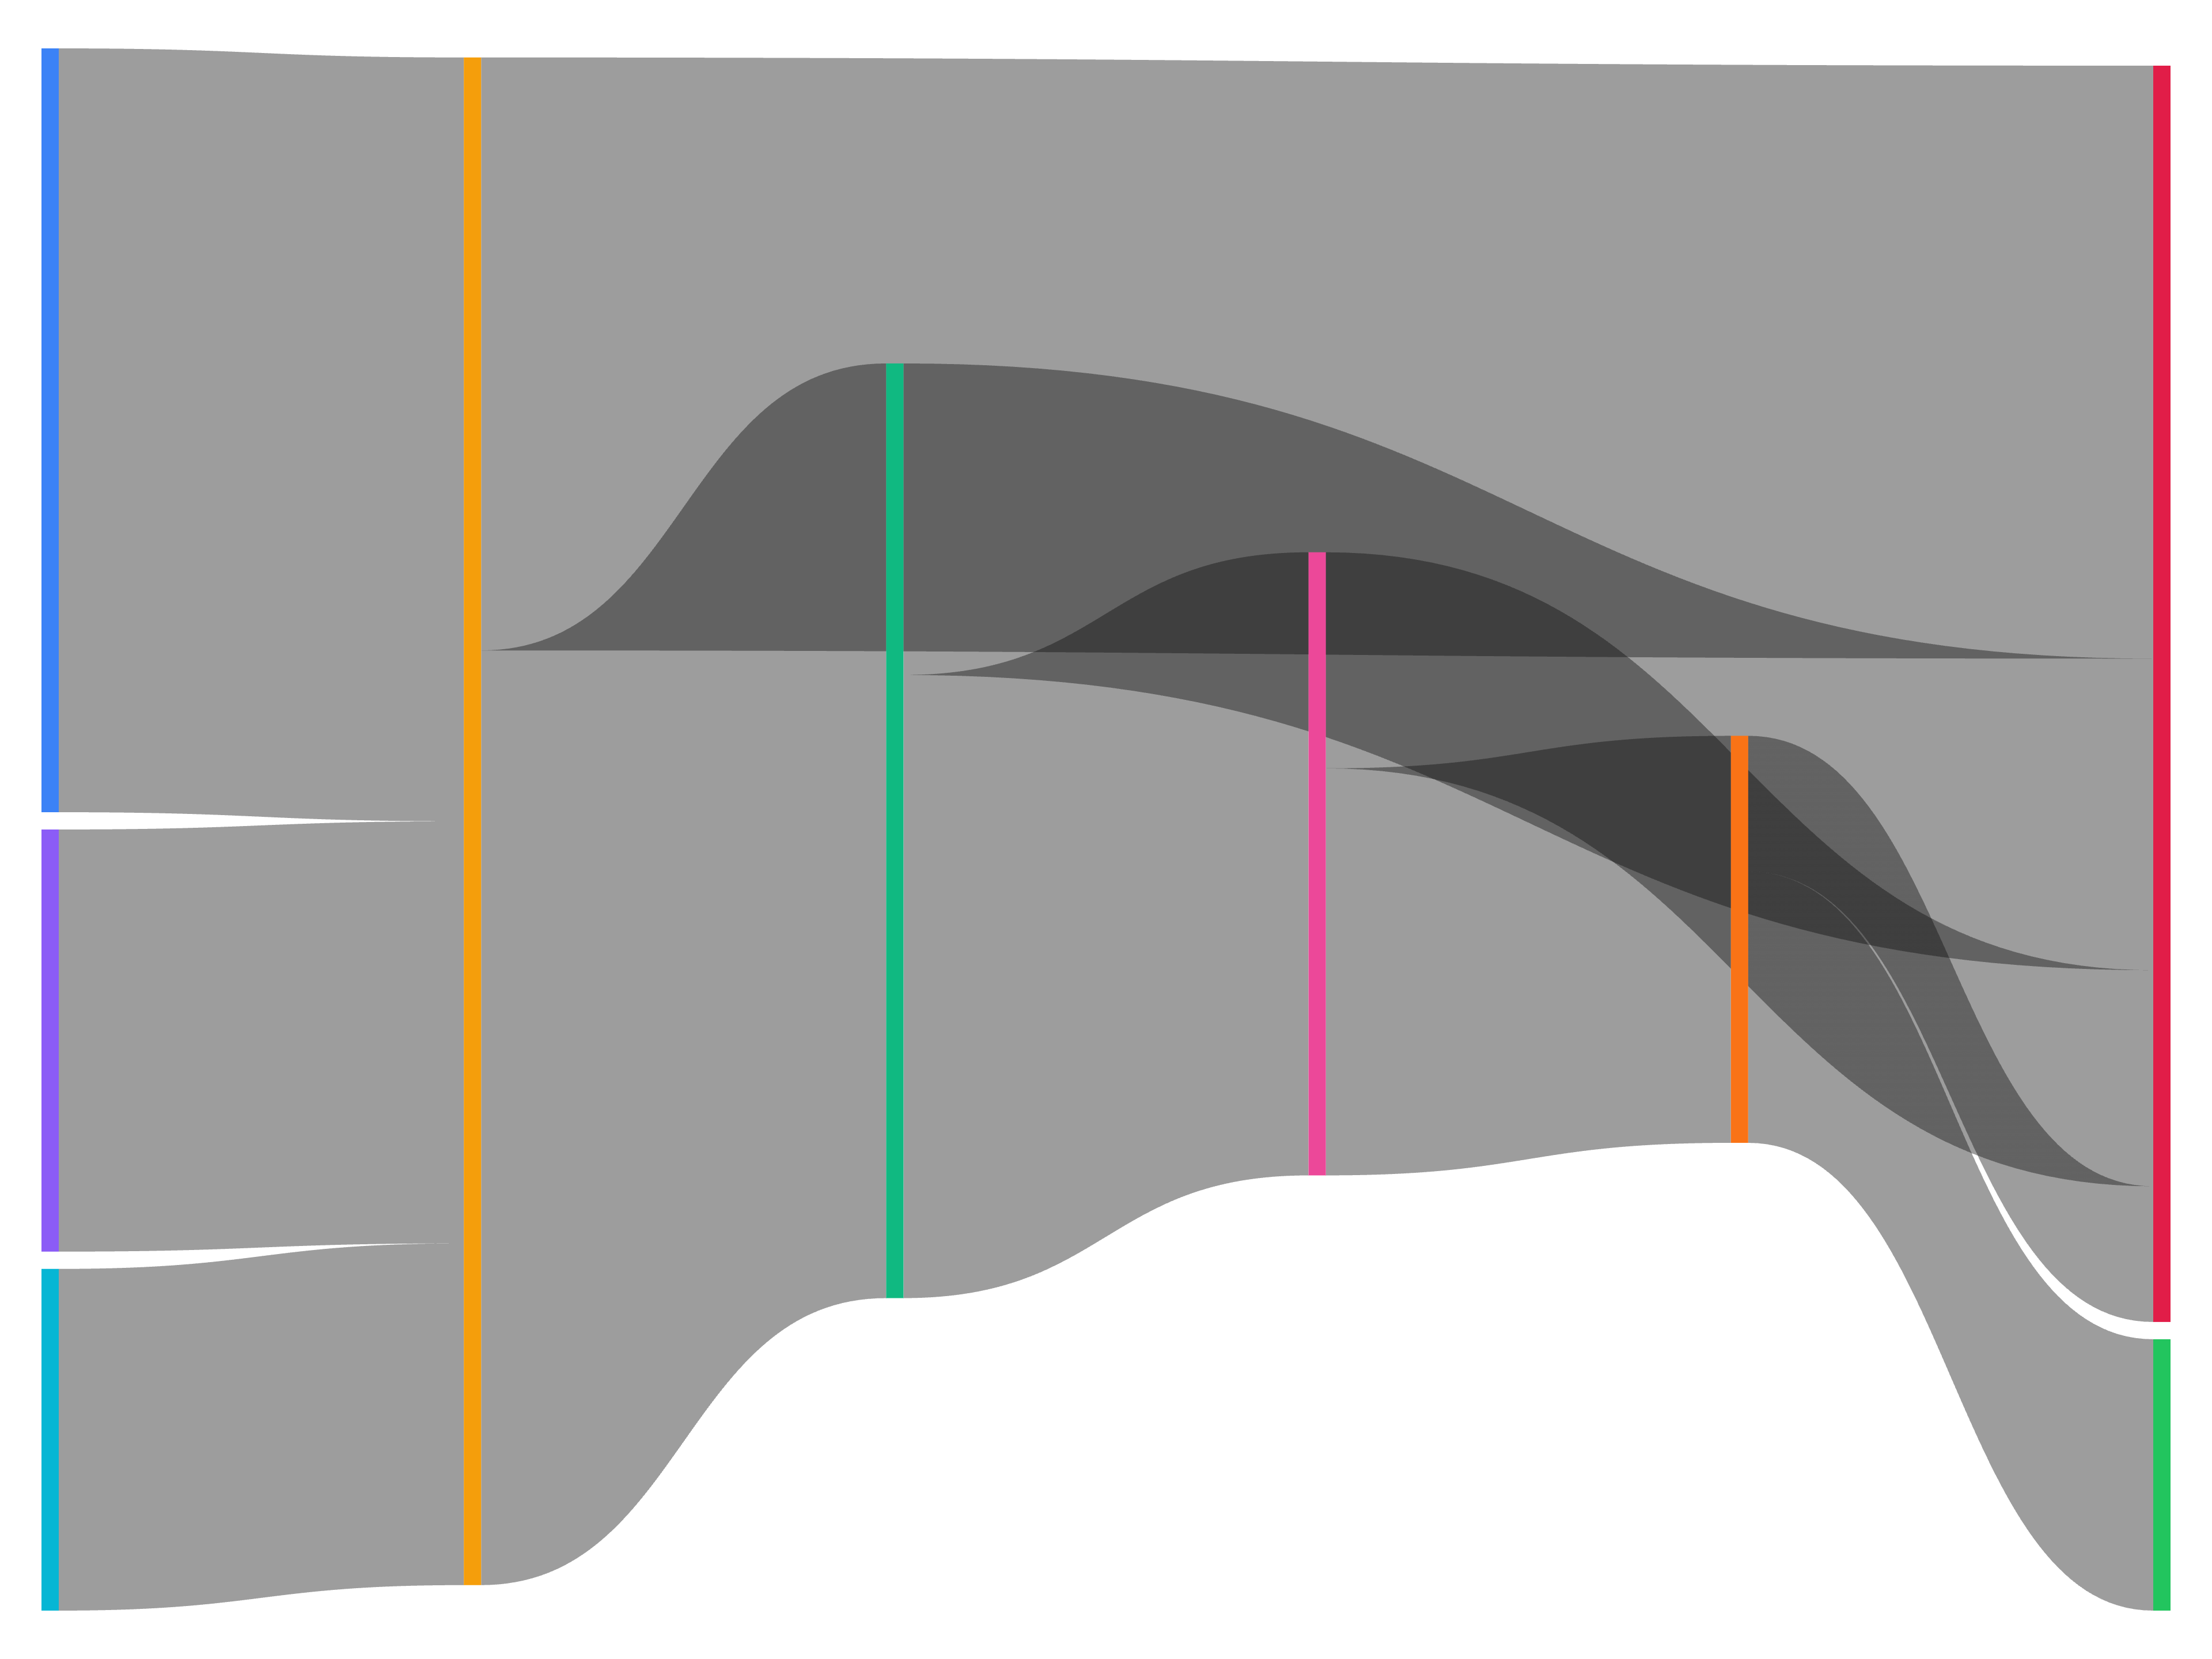
  • ECharts Sankey ChartECharts Sankey Chart

    ECharts Sankey Chart
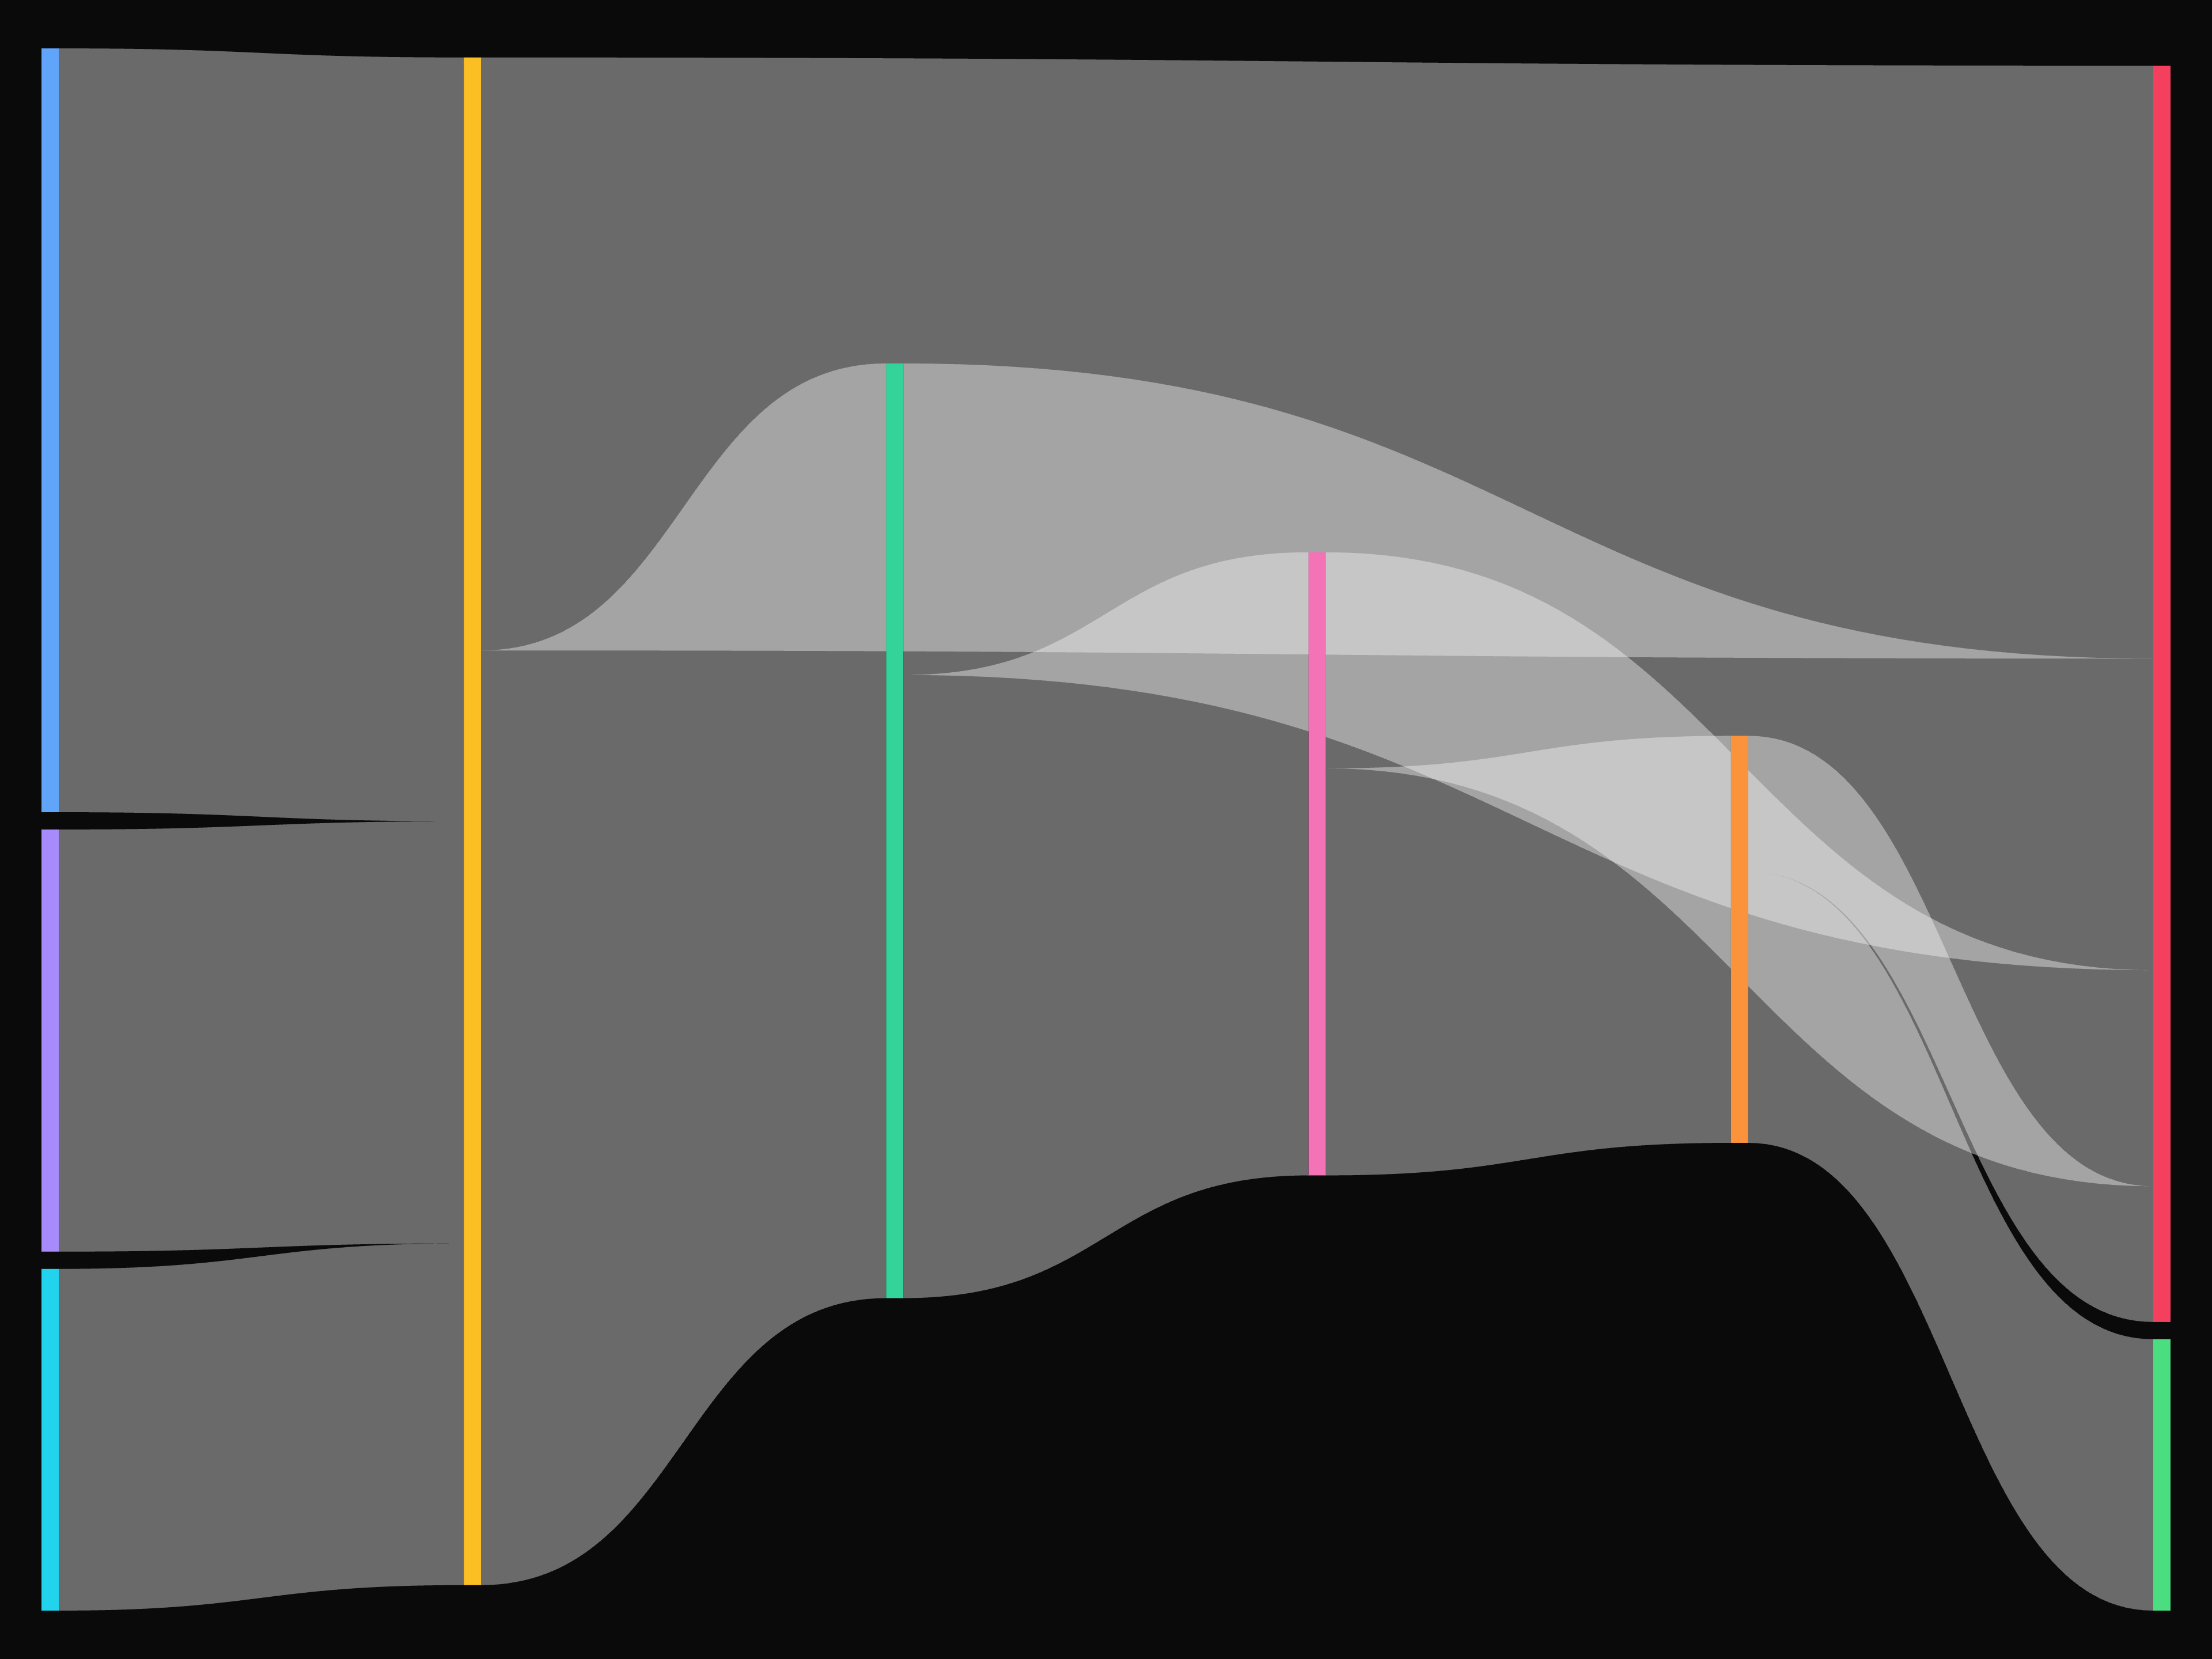
  • ECharts Sankey ChartECharts Sankey Chart

    ECharts Sankey Chart
  • ECharts Sankey ChartECharts Sankey Chart

    ECharts Sankey Chart
  • ECharts Sankey ChartECharts Sankey Chart

    ECharts Sankey Chart

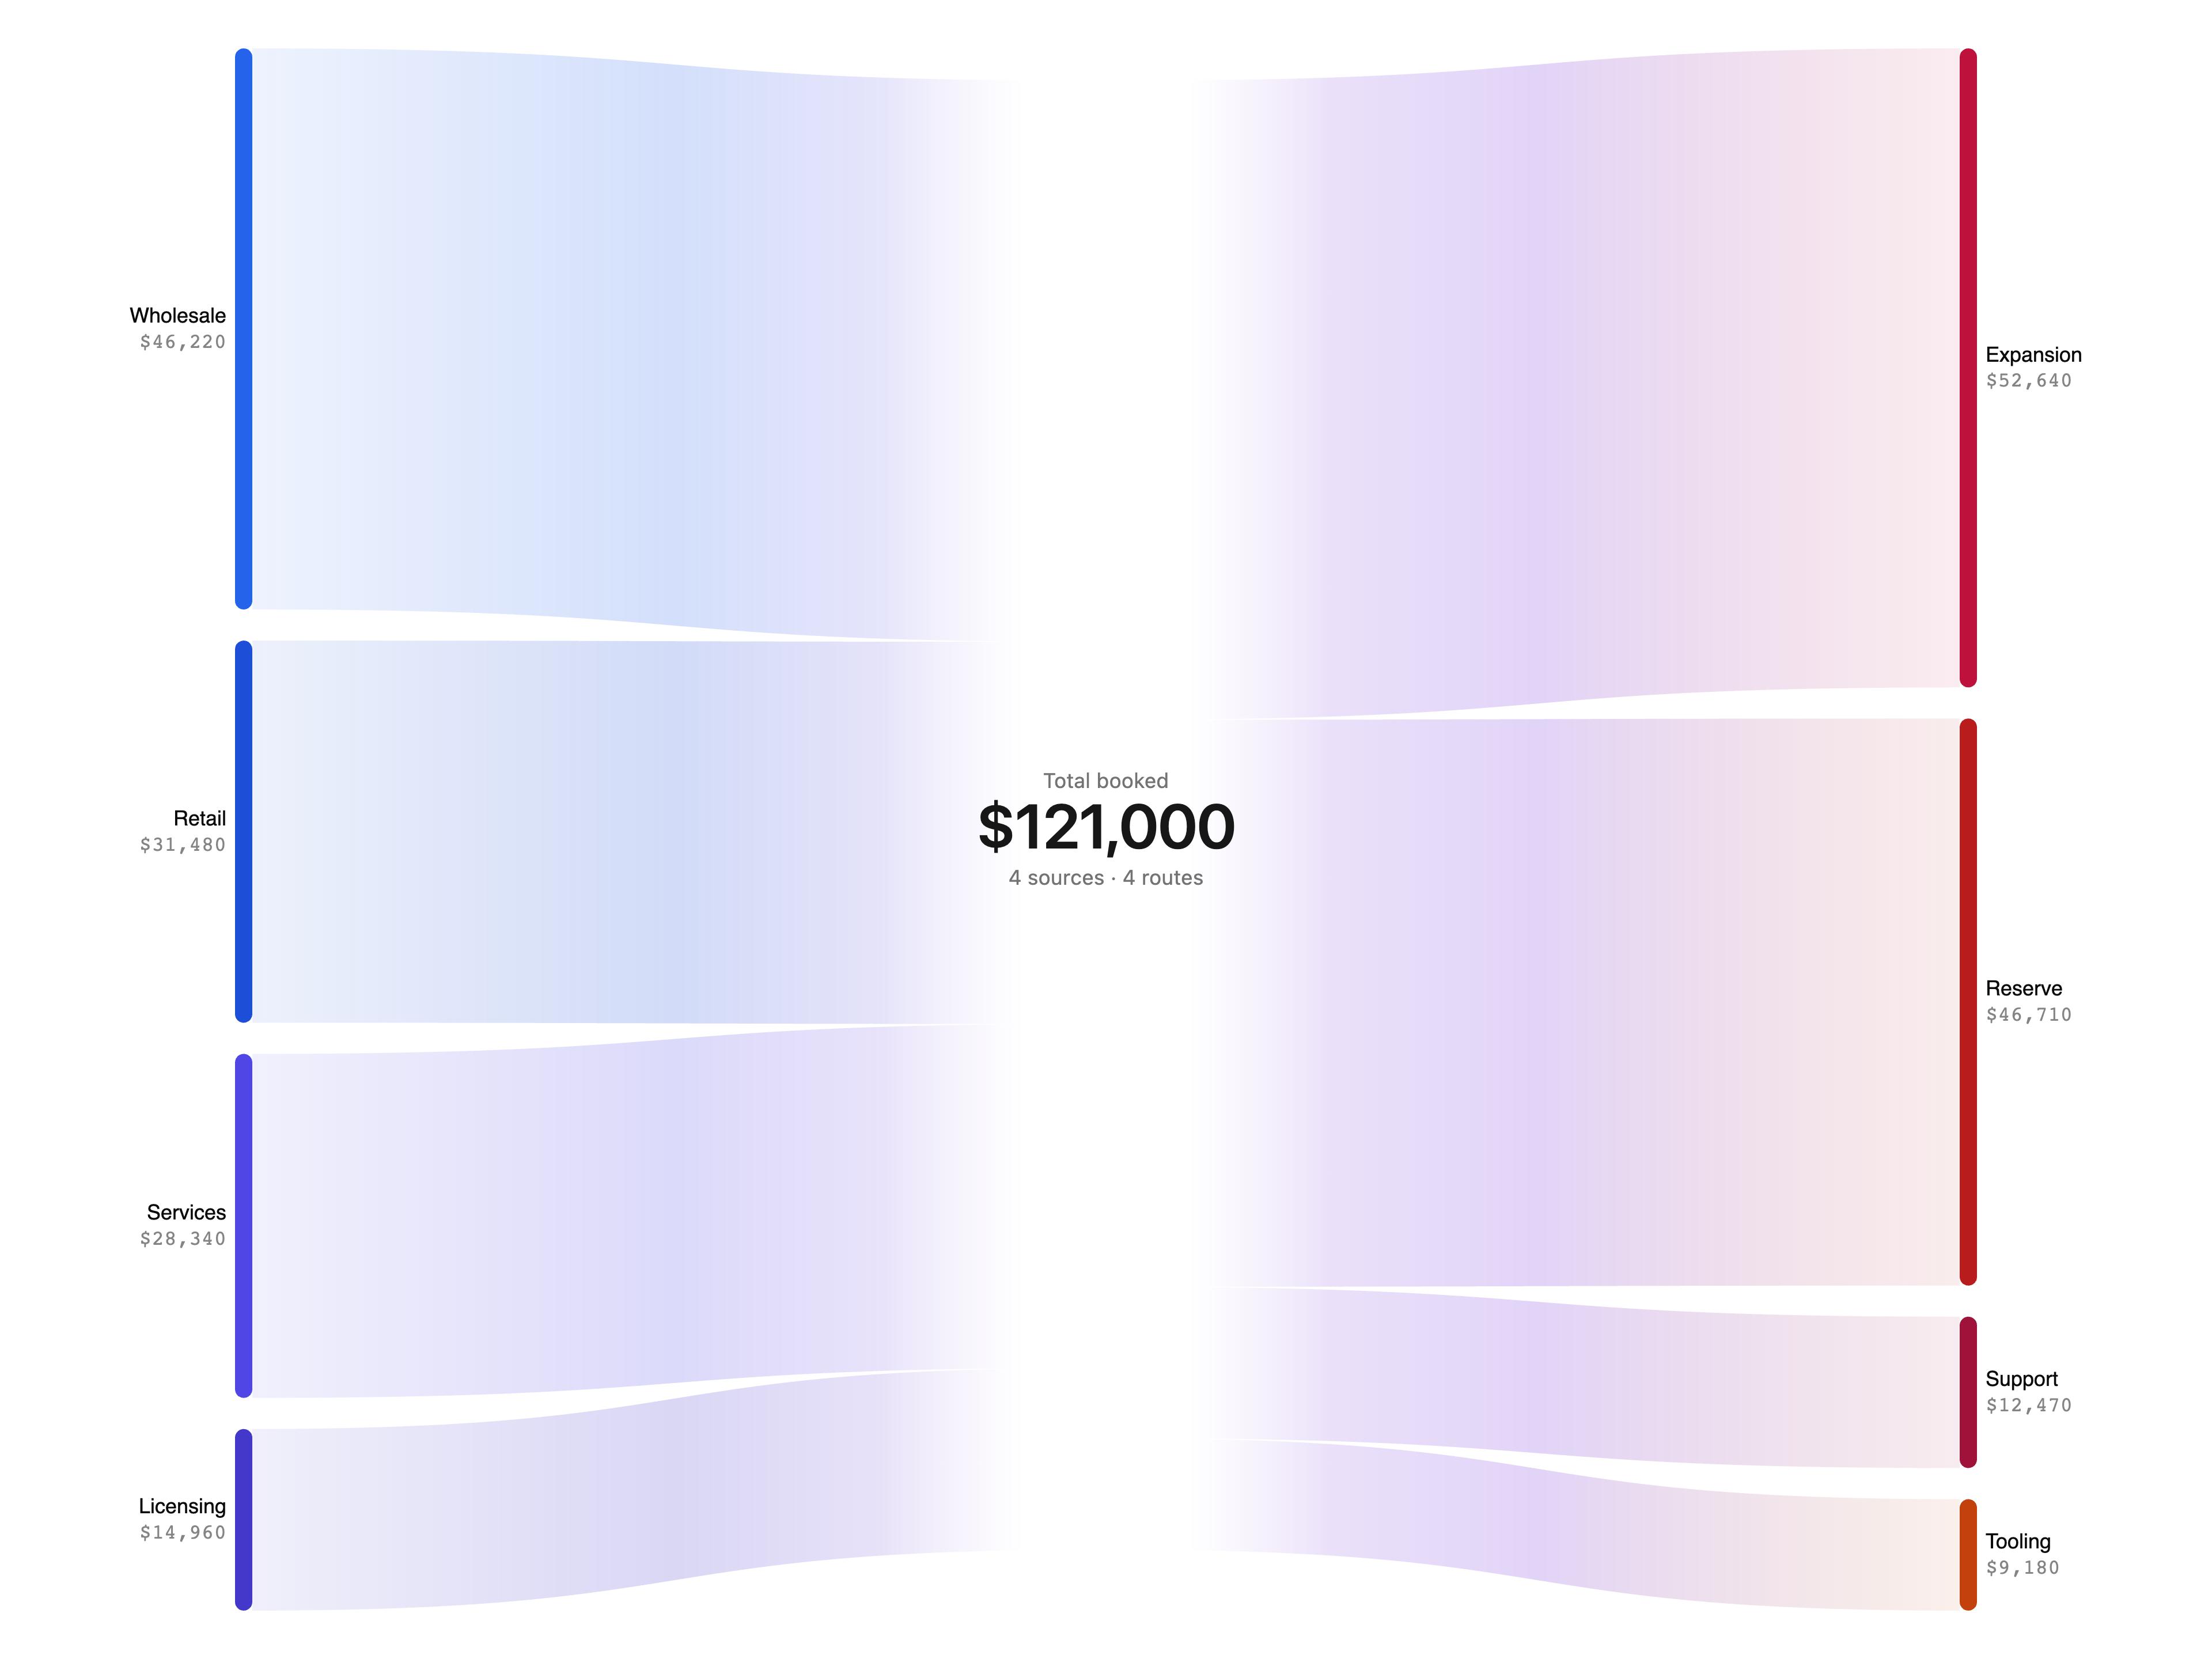
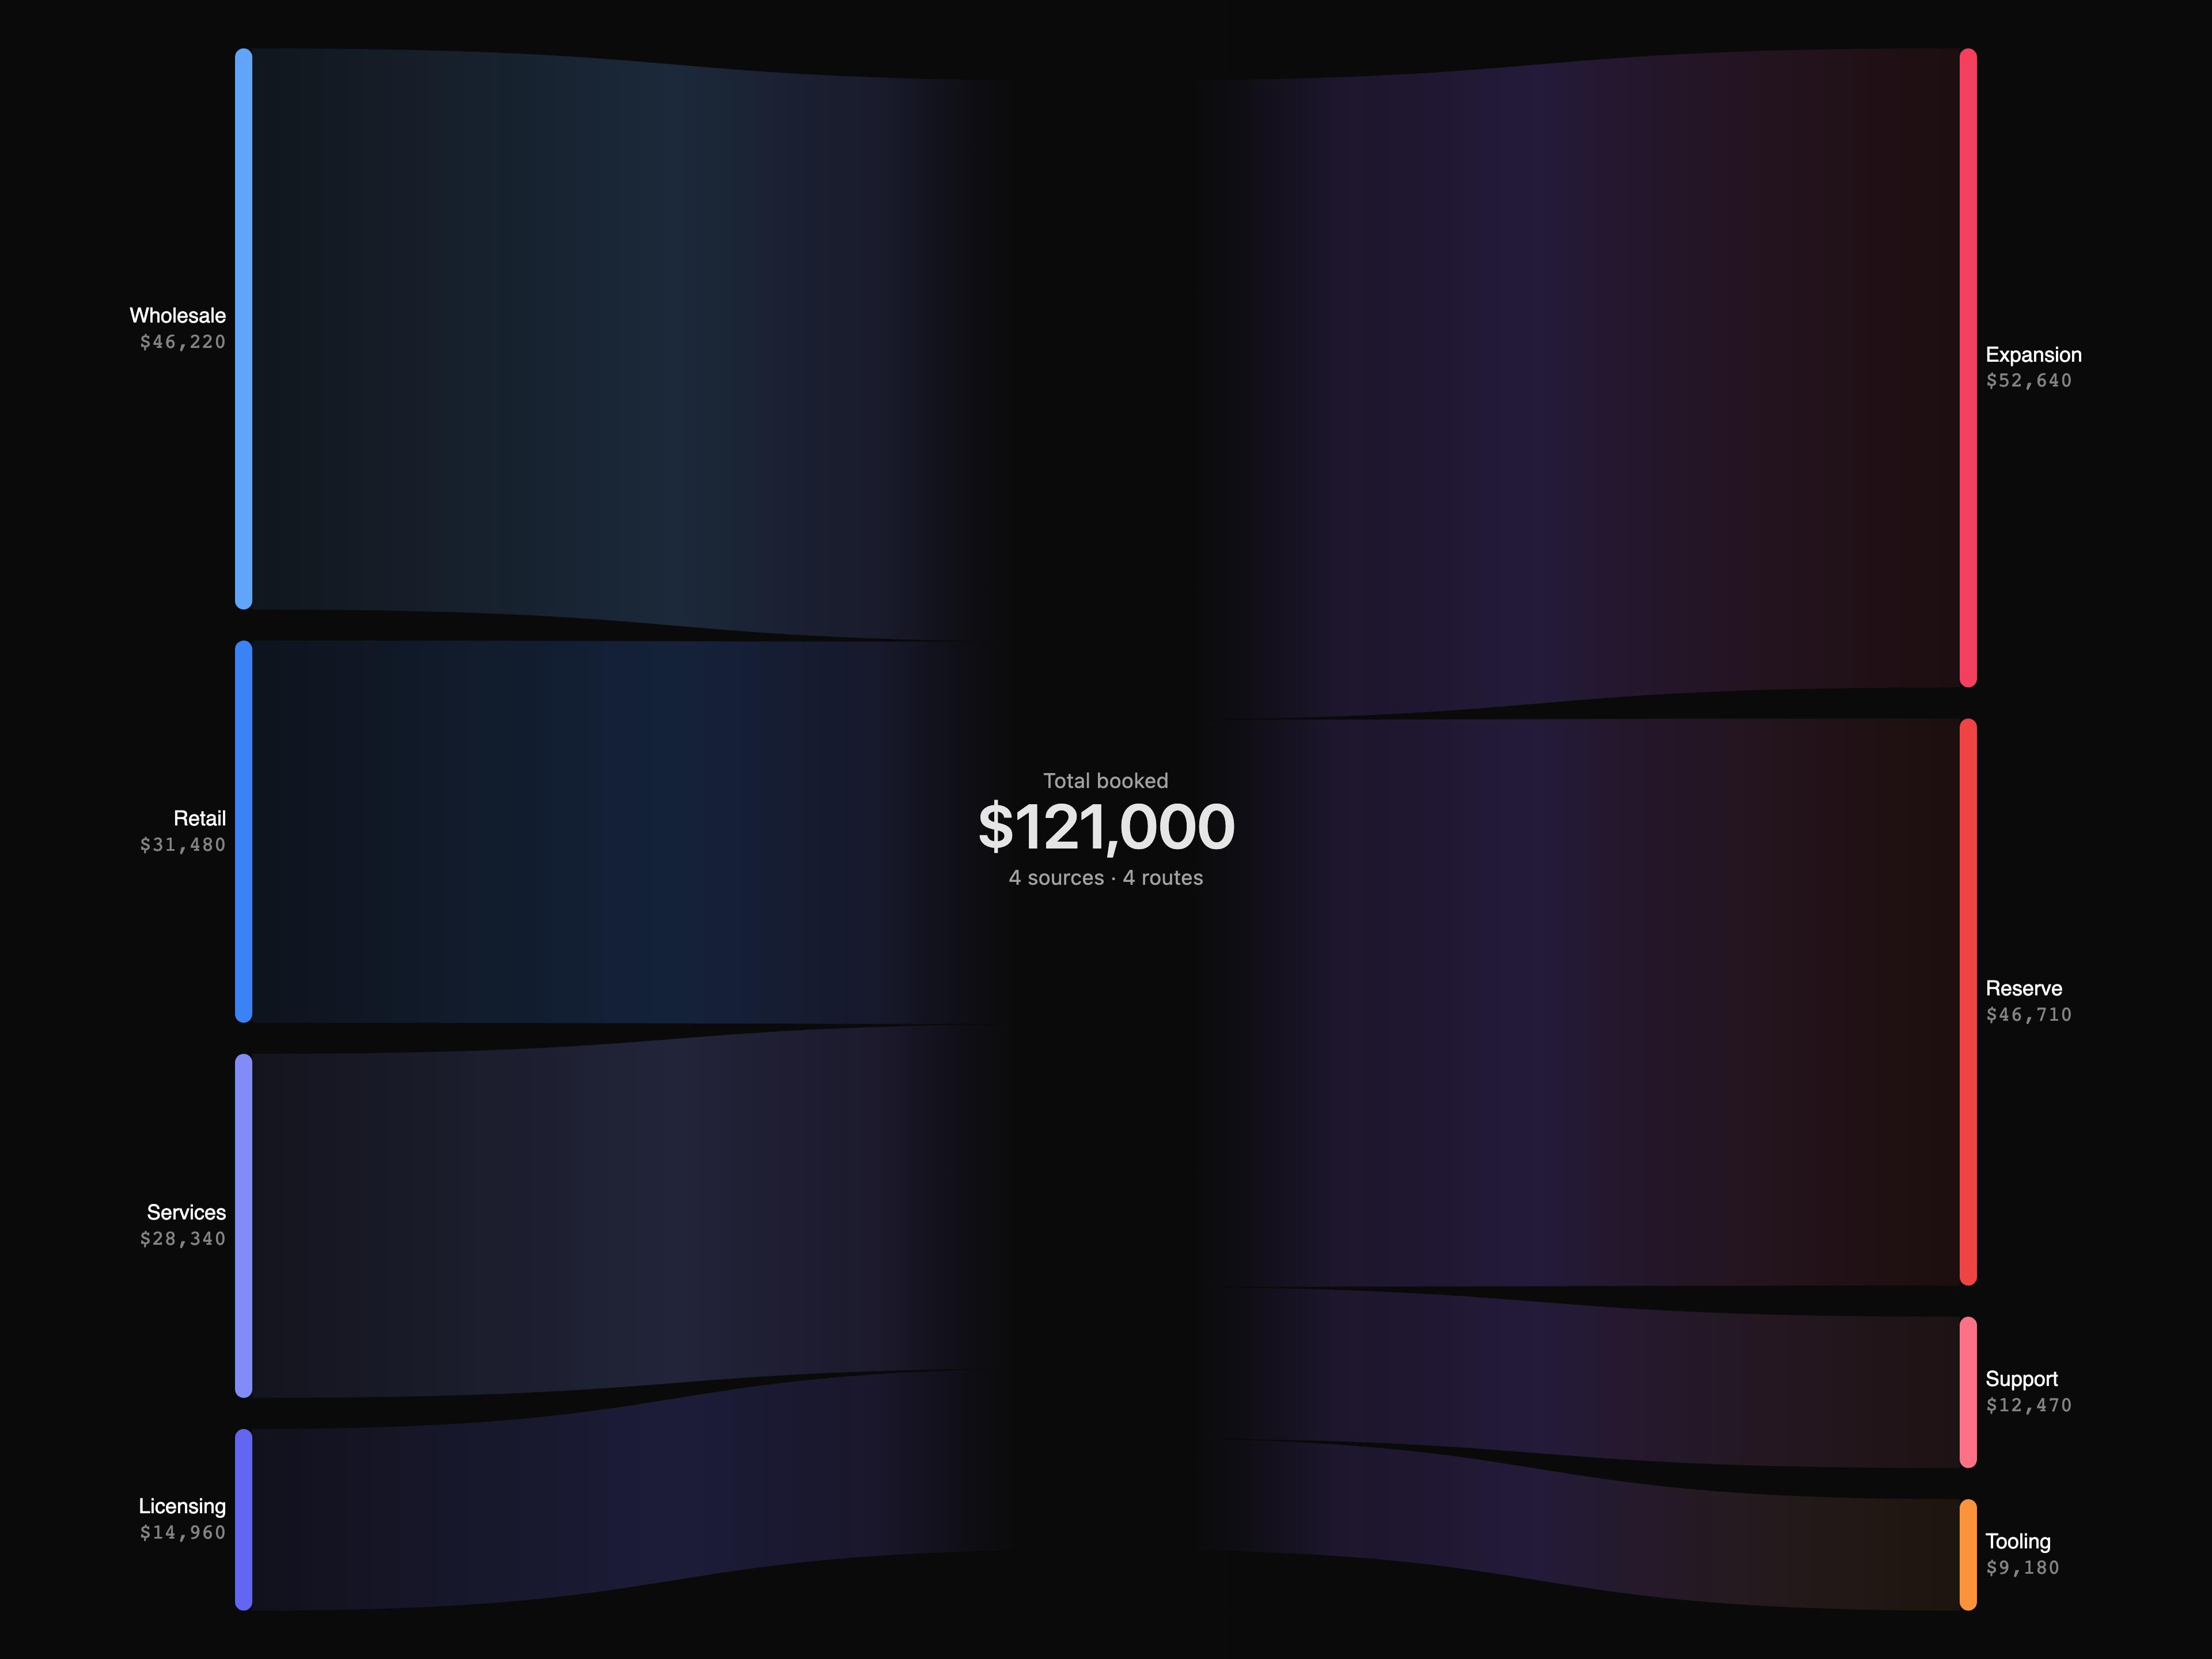
  • Allocation Sankey Chart

    Allocation Sankey Chart
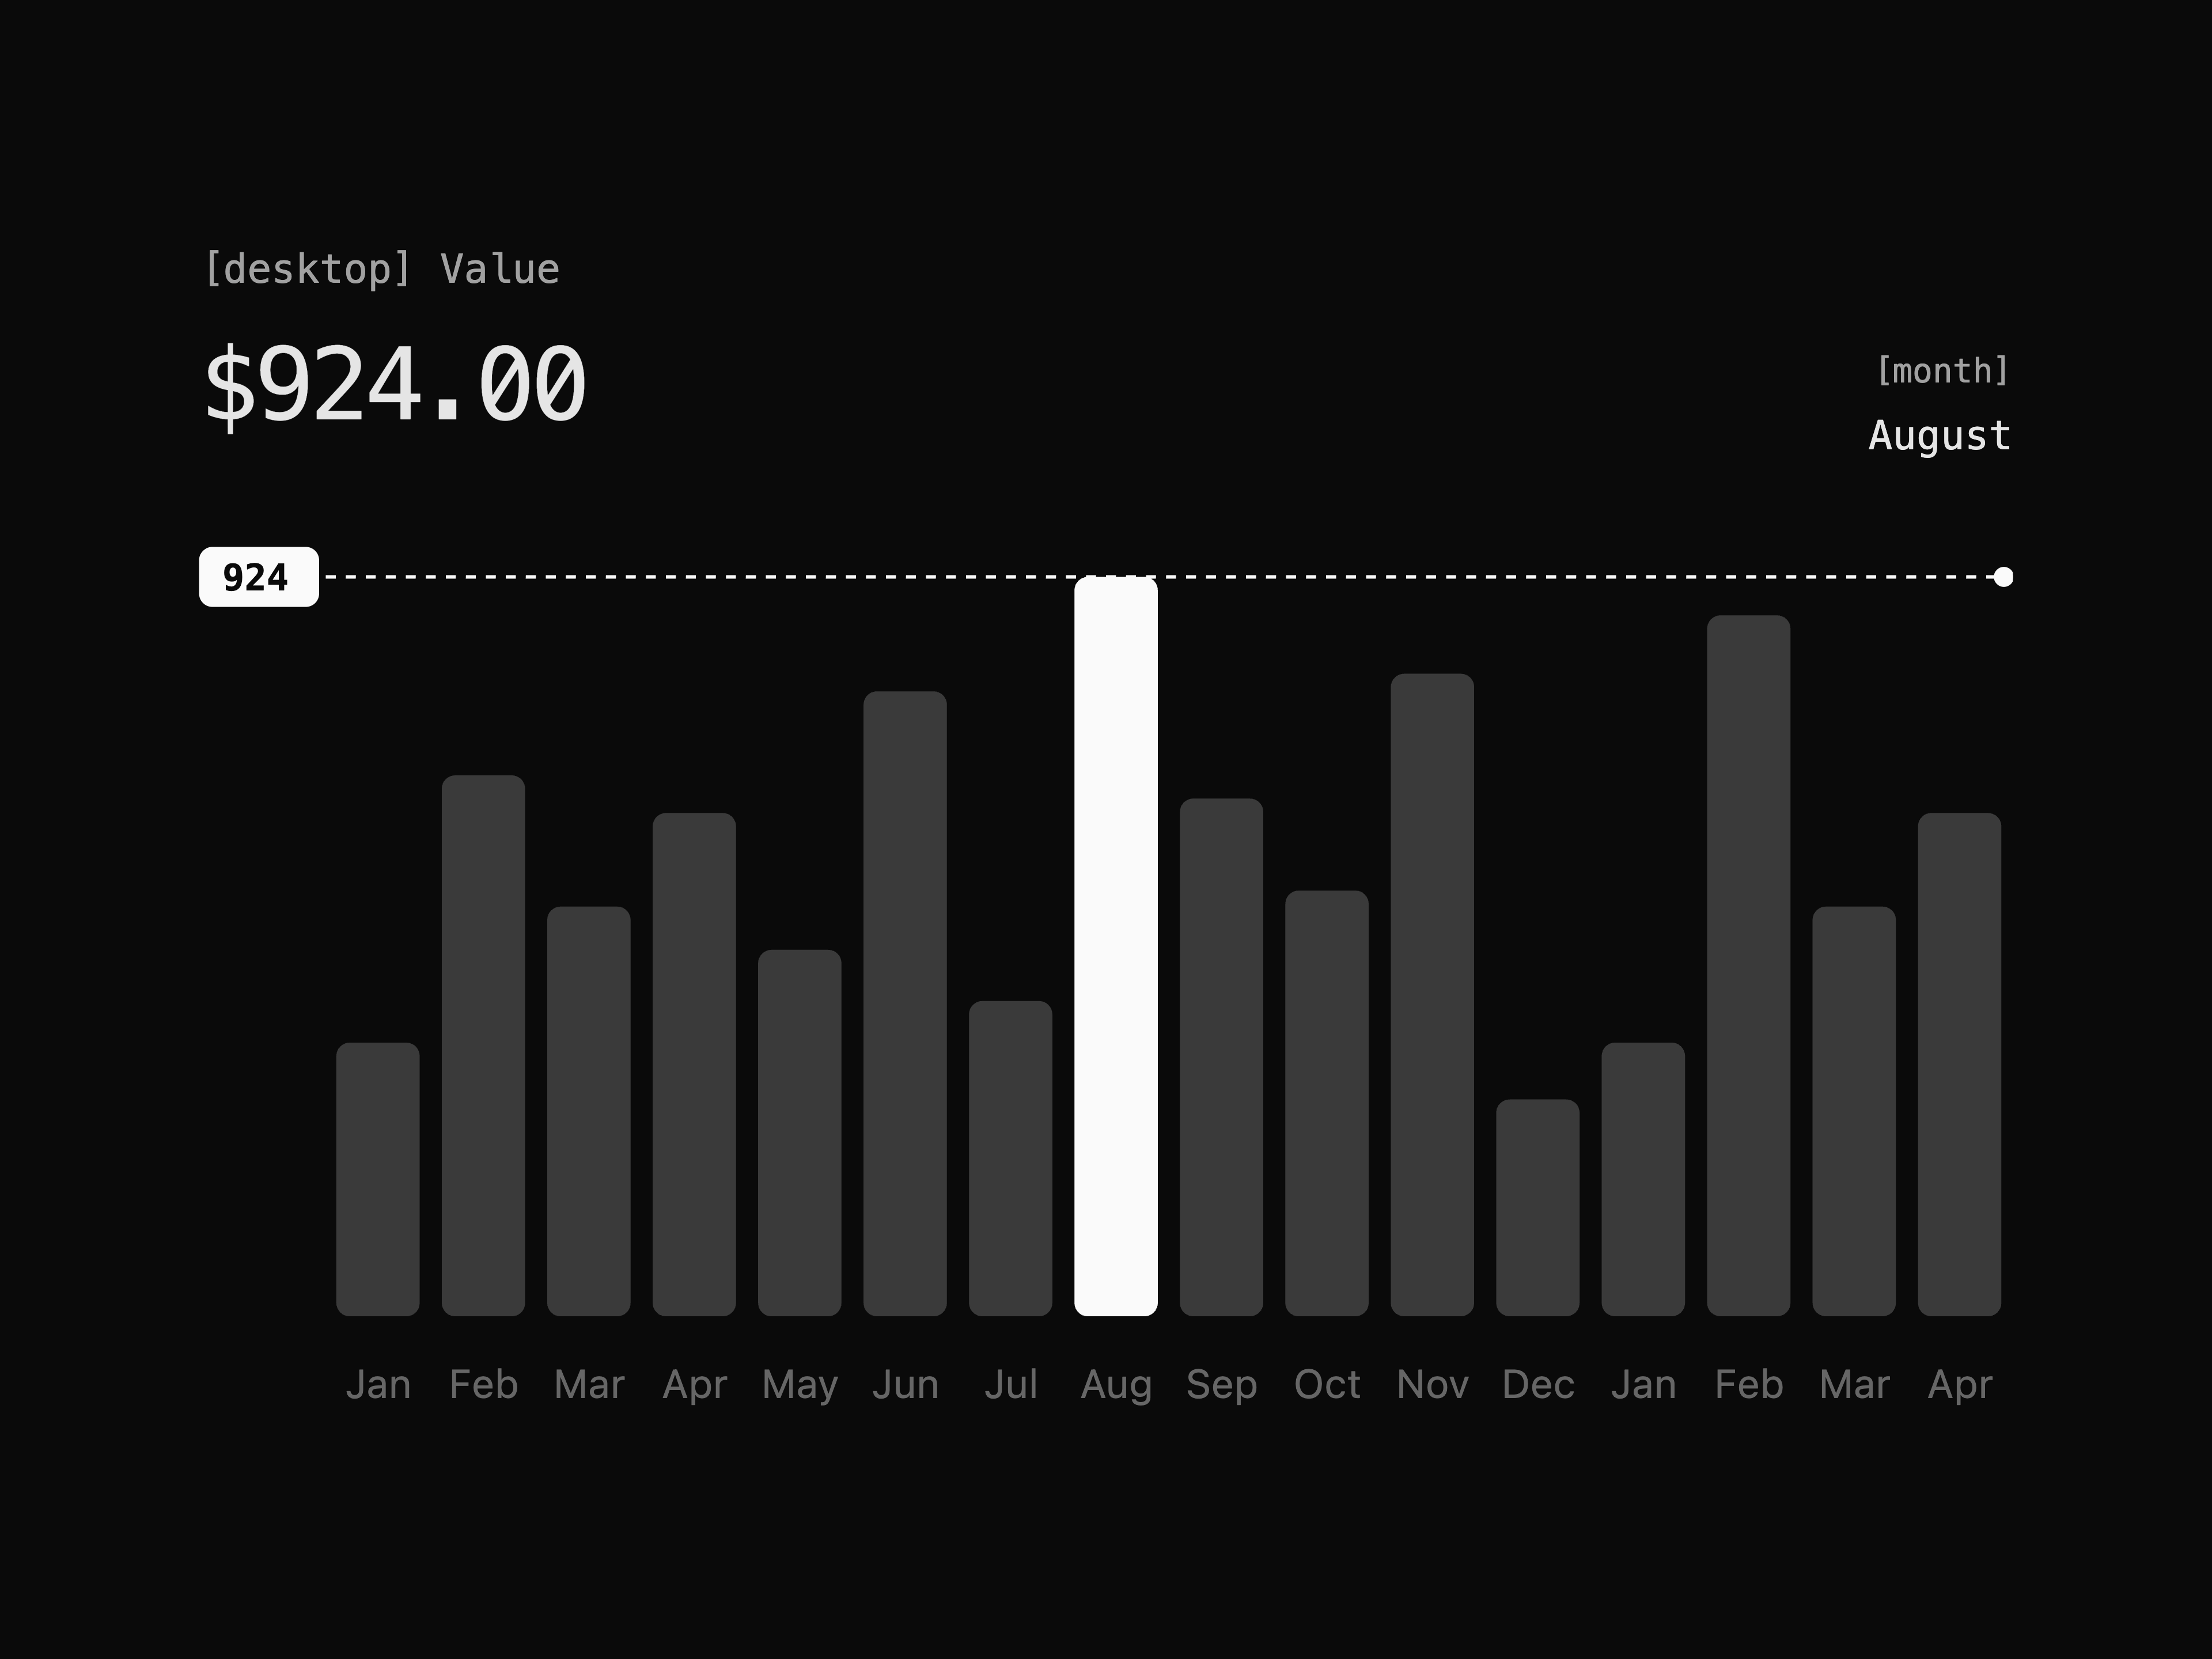
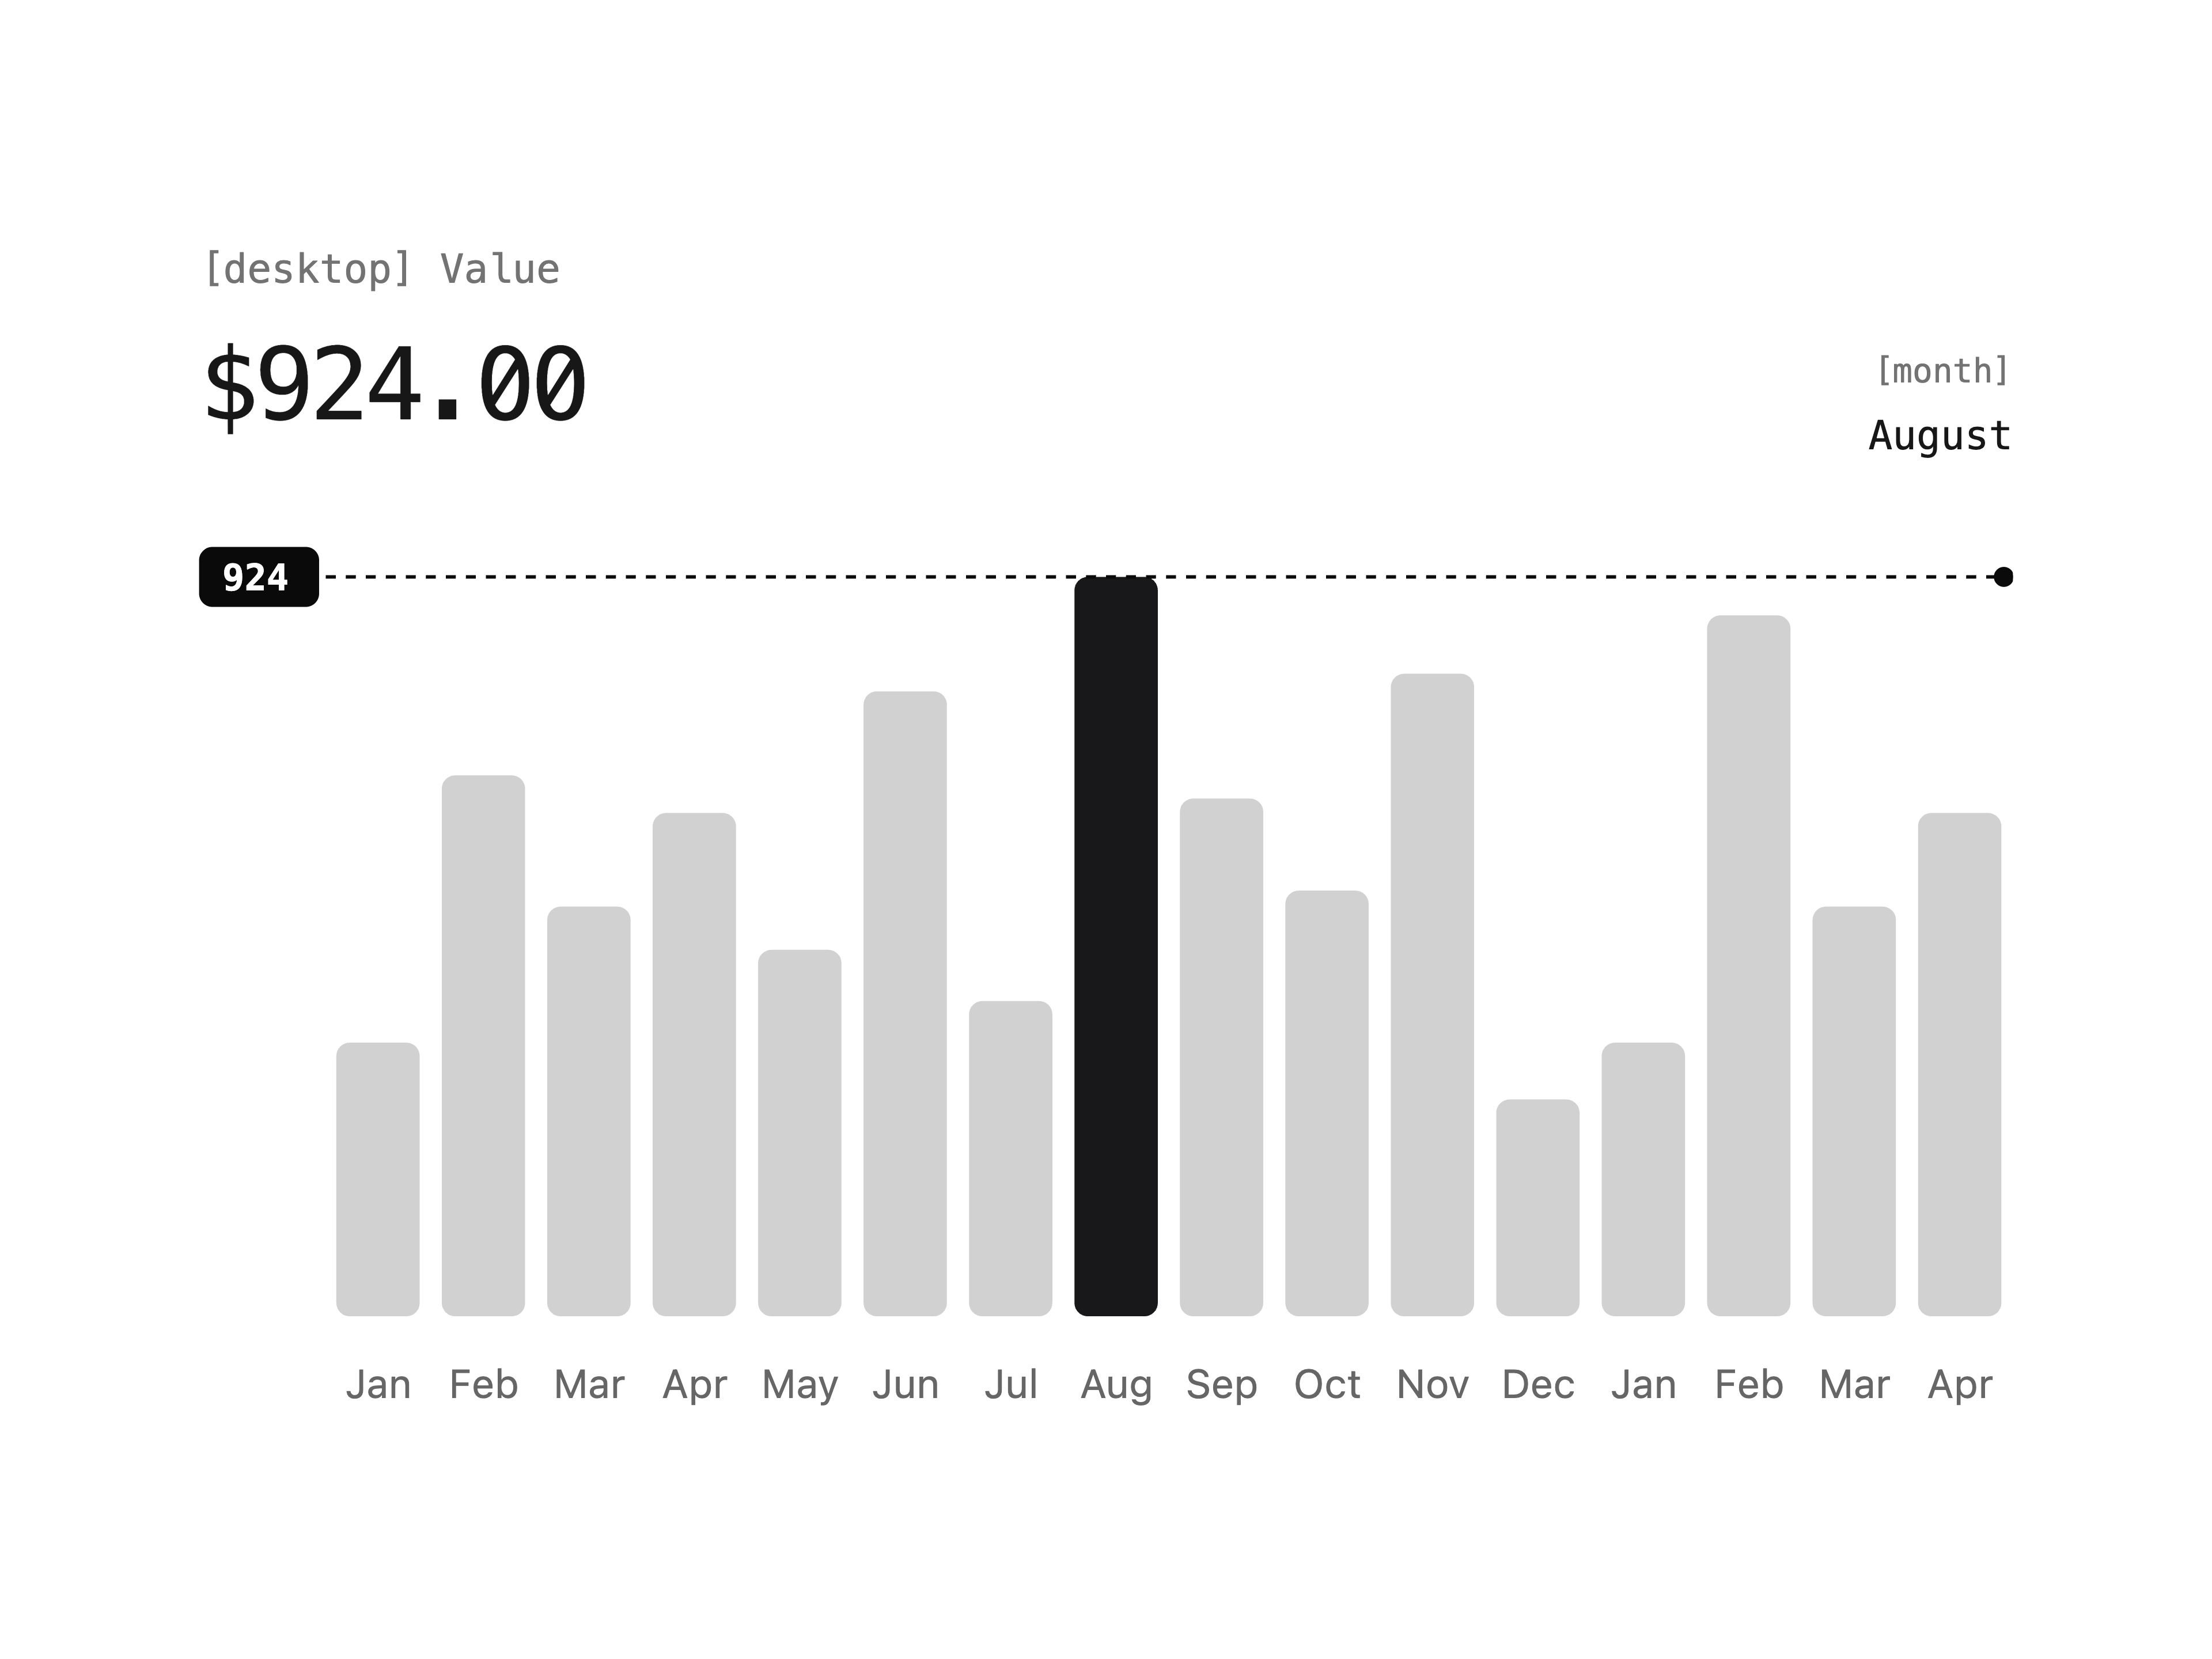
  • Hover Trace Bar ChartHover Trace Bar Chart

    Hover Trace Bar Chart

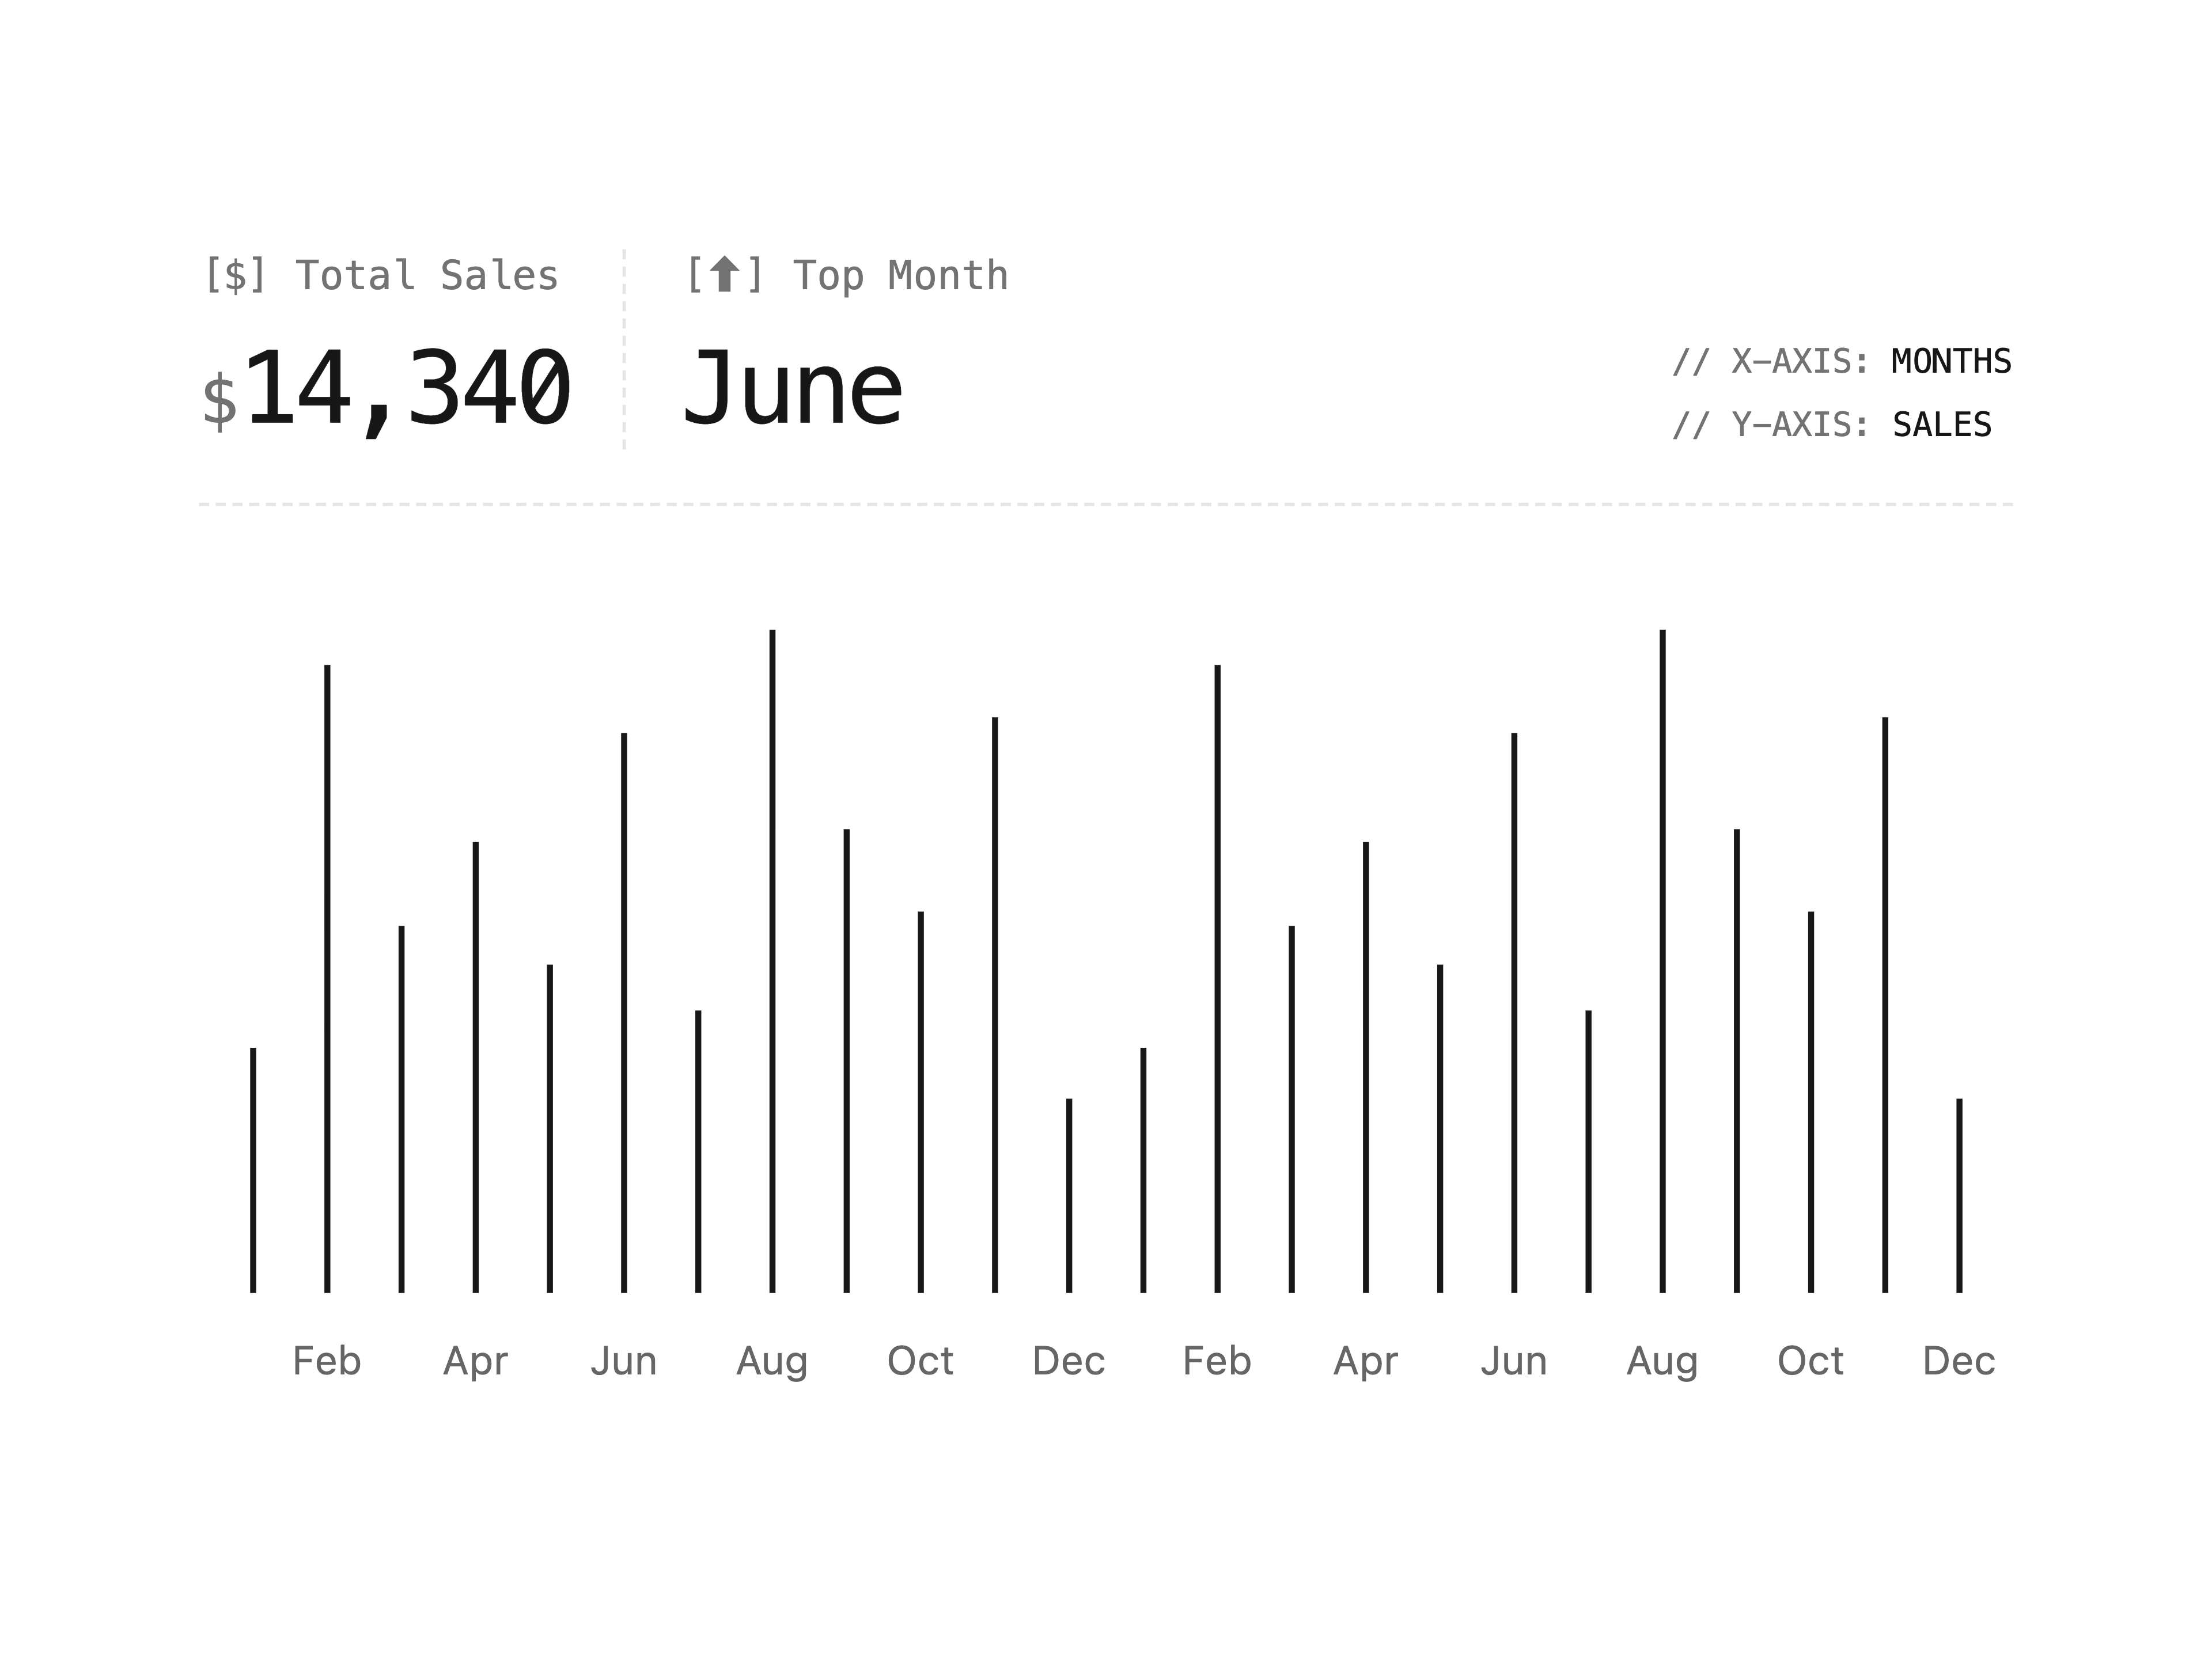
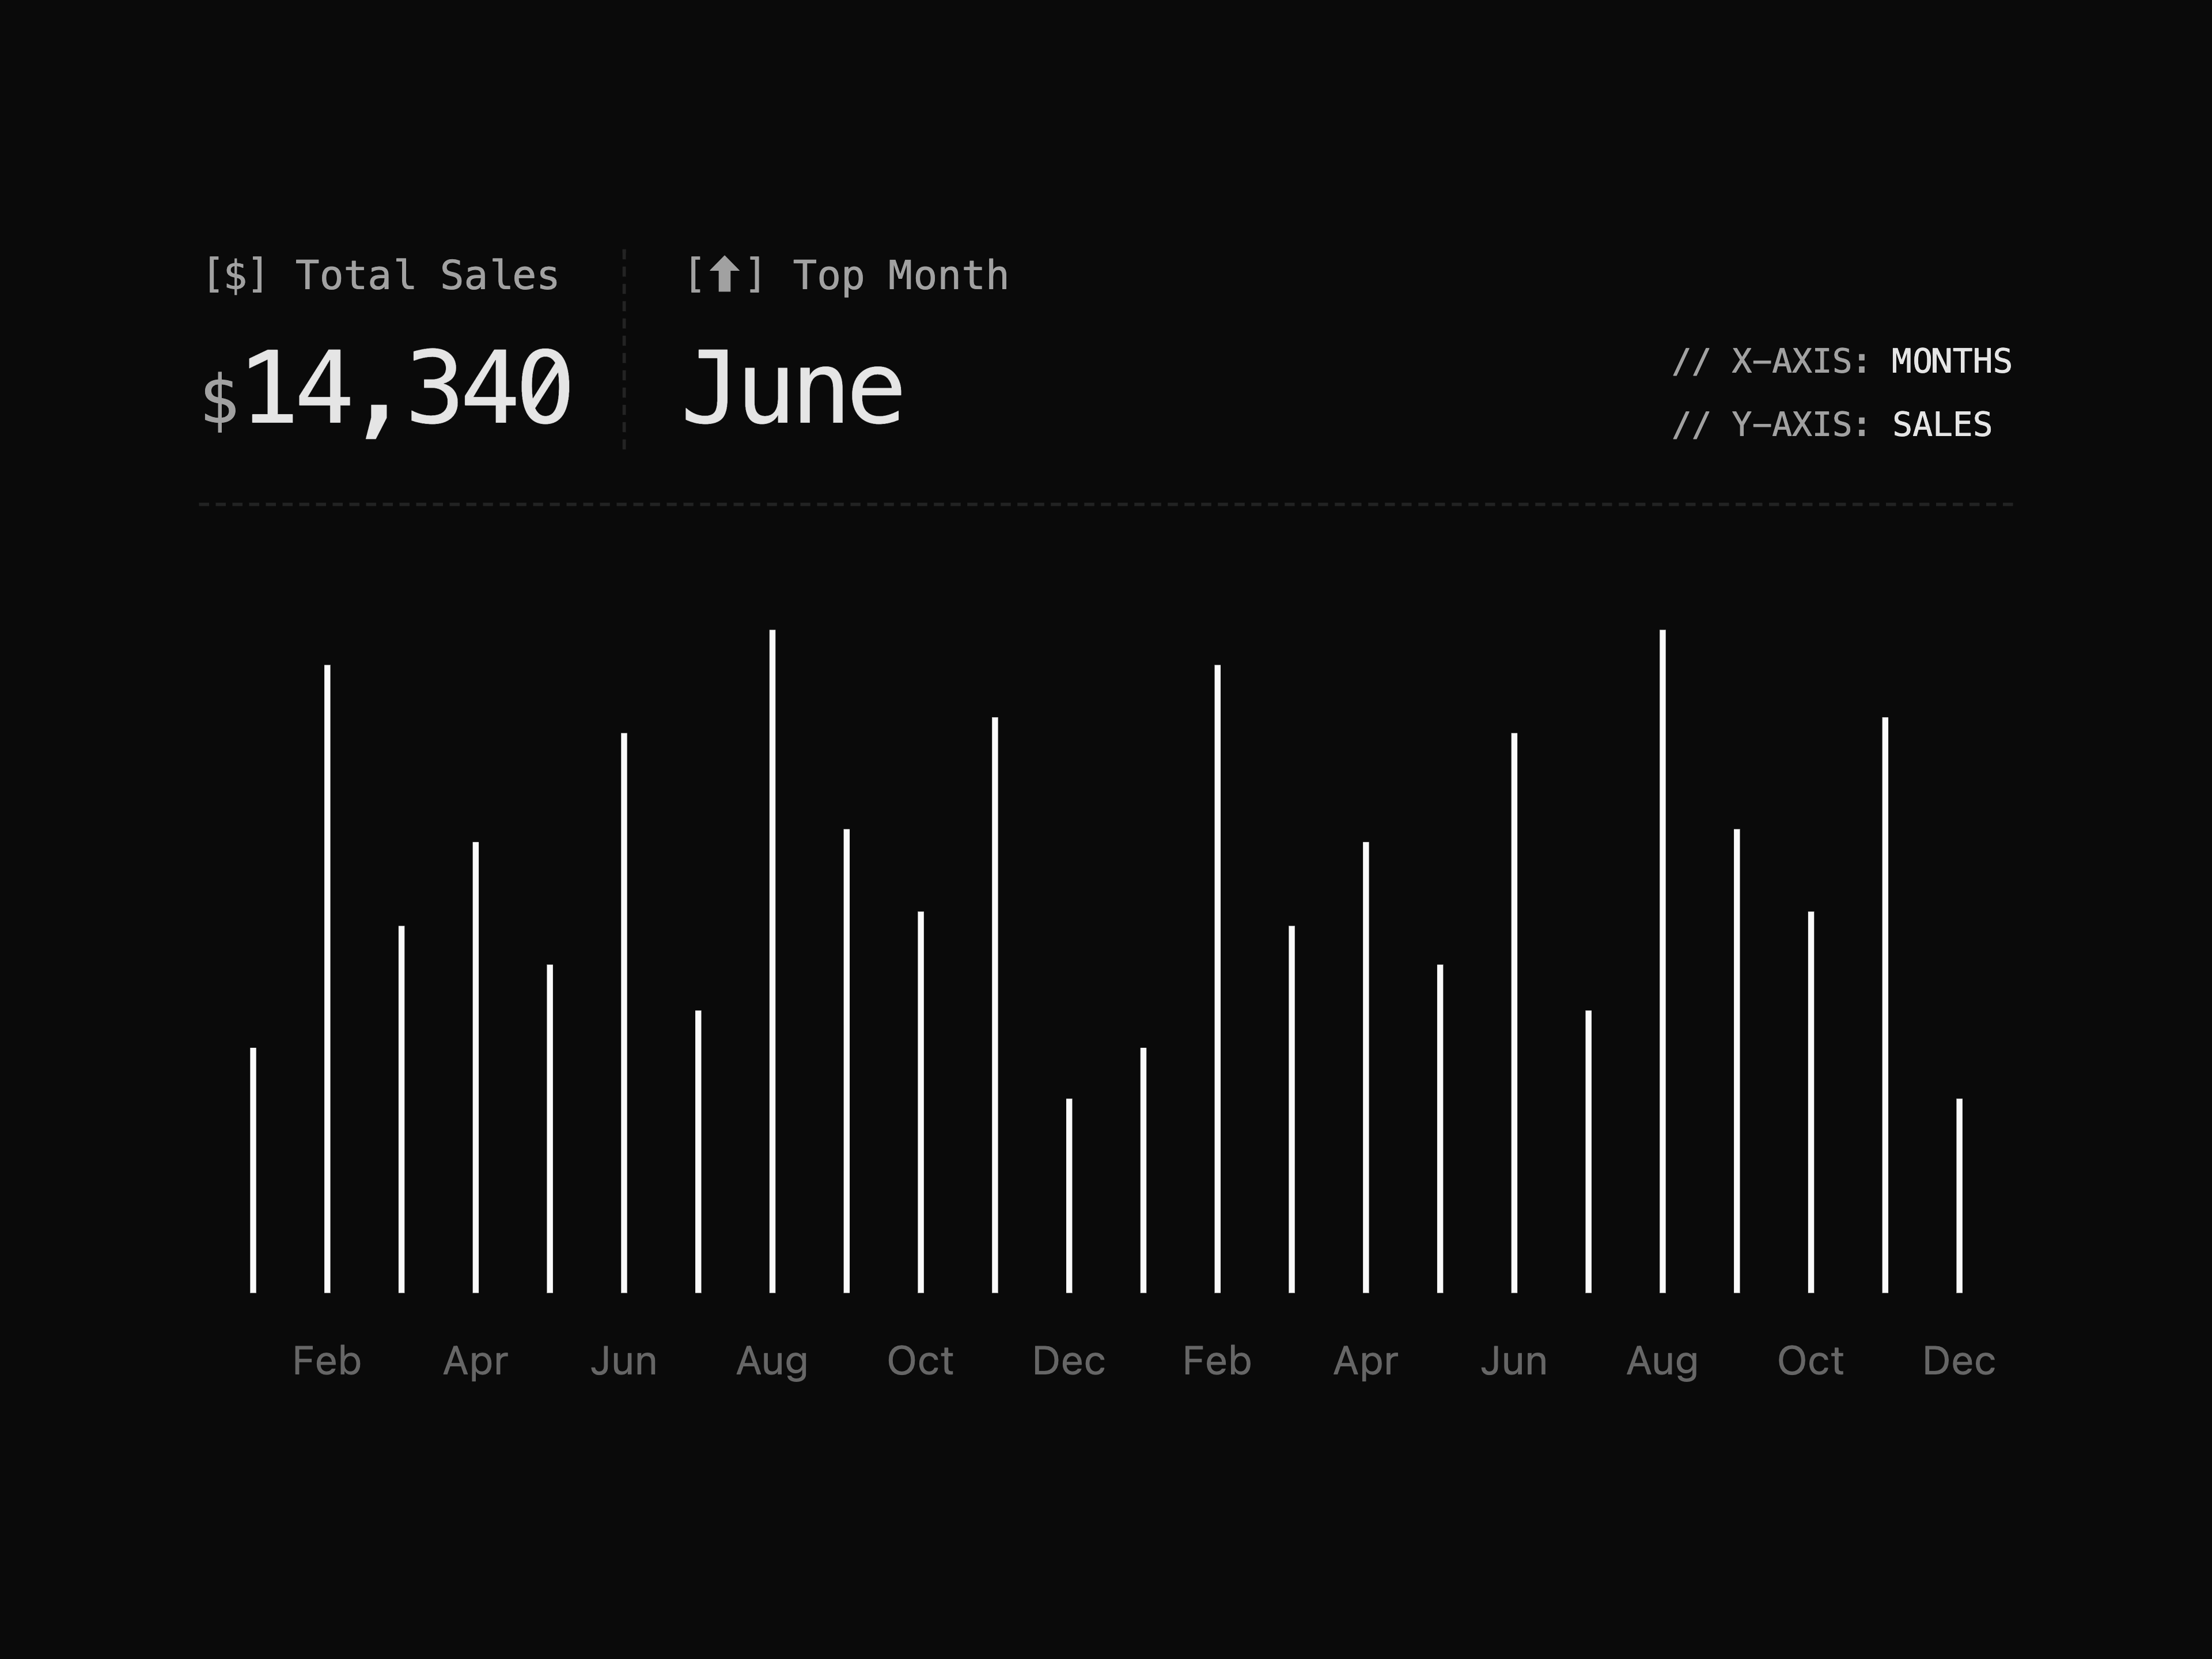
  • Monospace Bar ChartMonospace Bar Chart

    Monospace Bar Chart

  • Pipeline Sankey ChartPipeline Sankey Chart

    Pipeline Sankey Chart

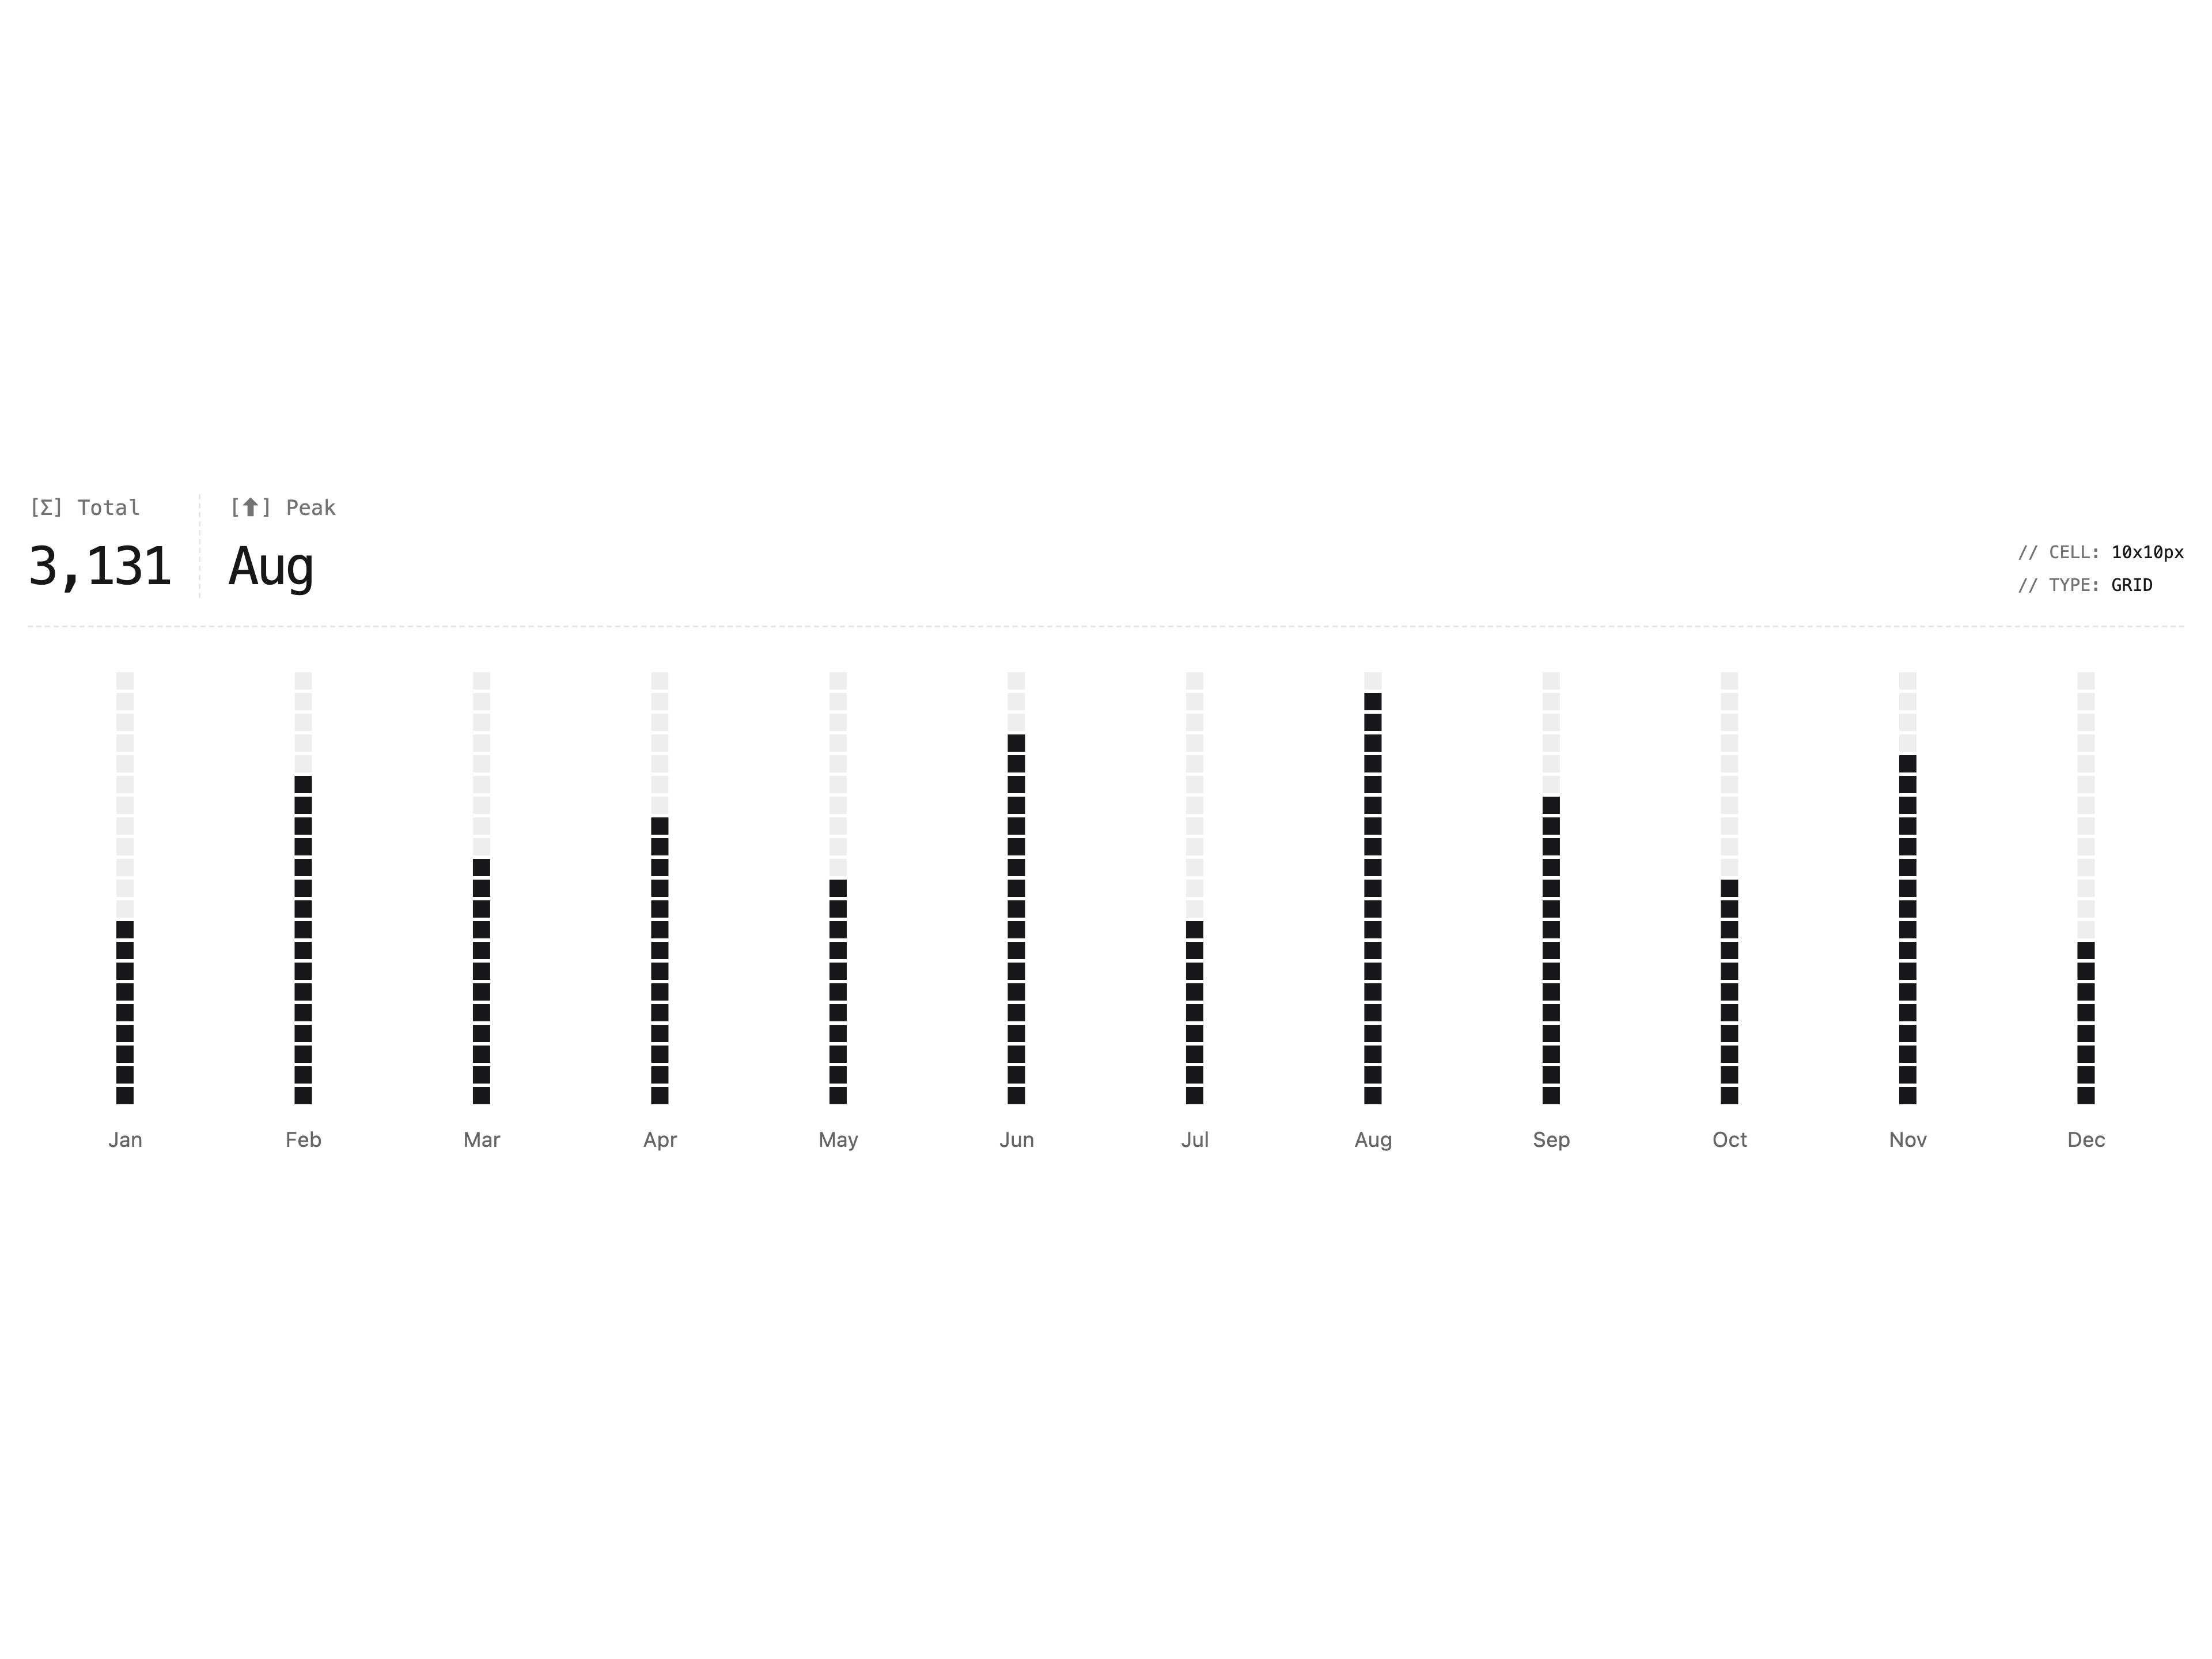
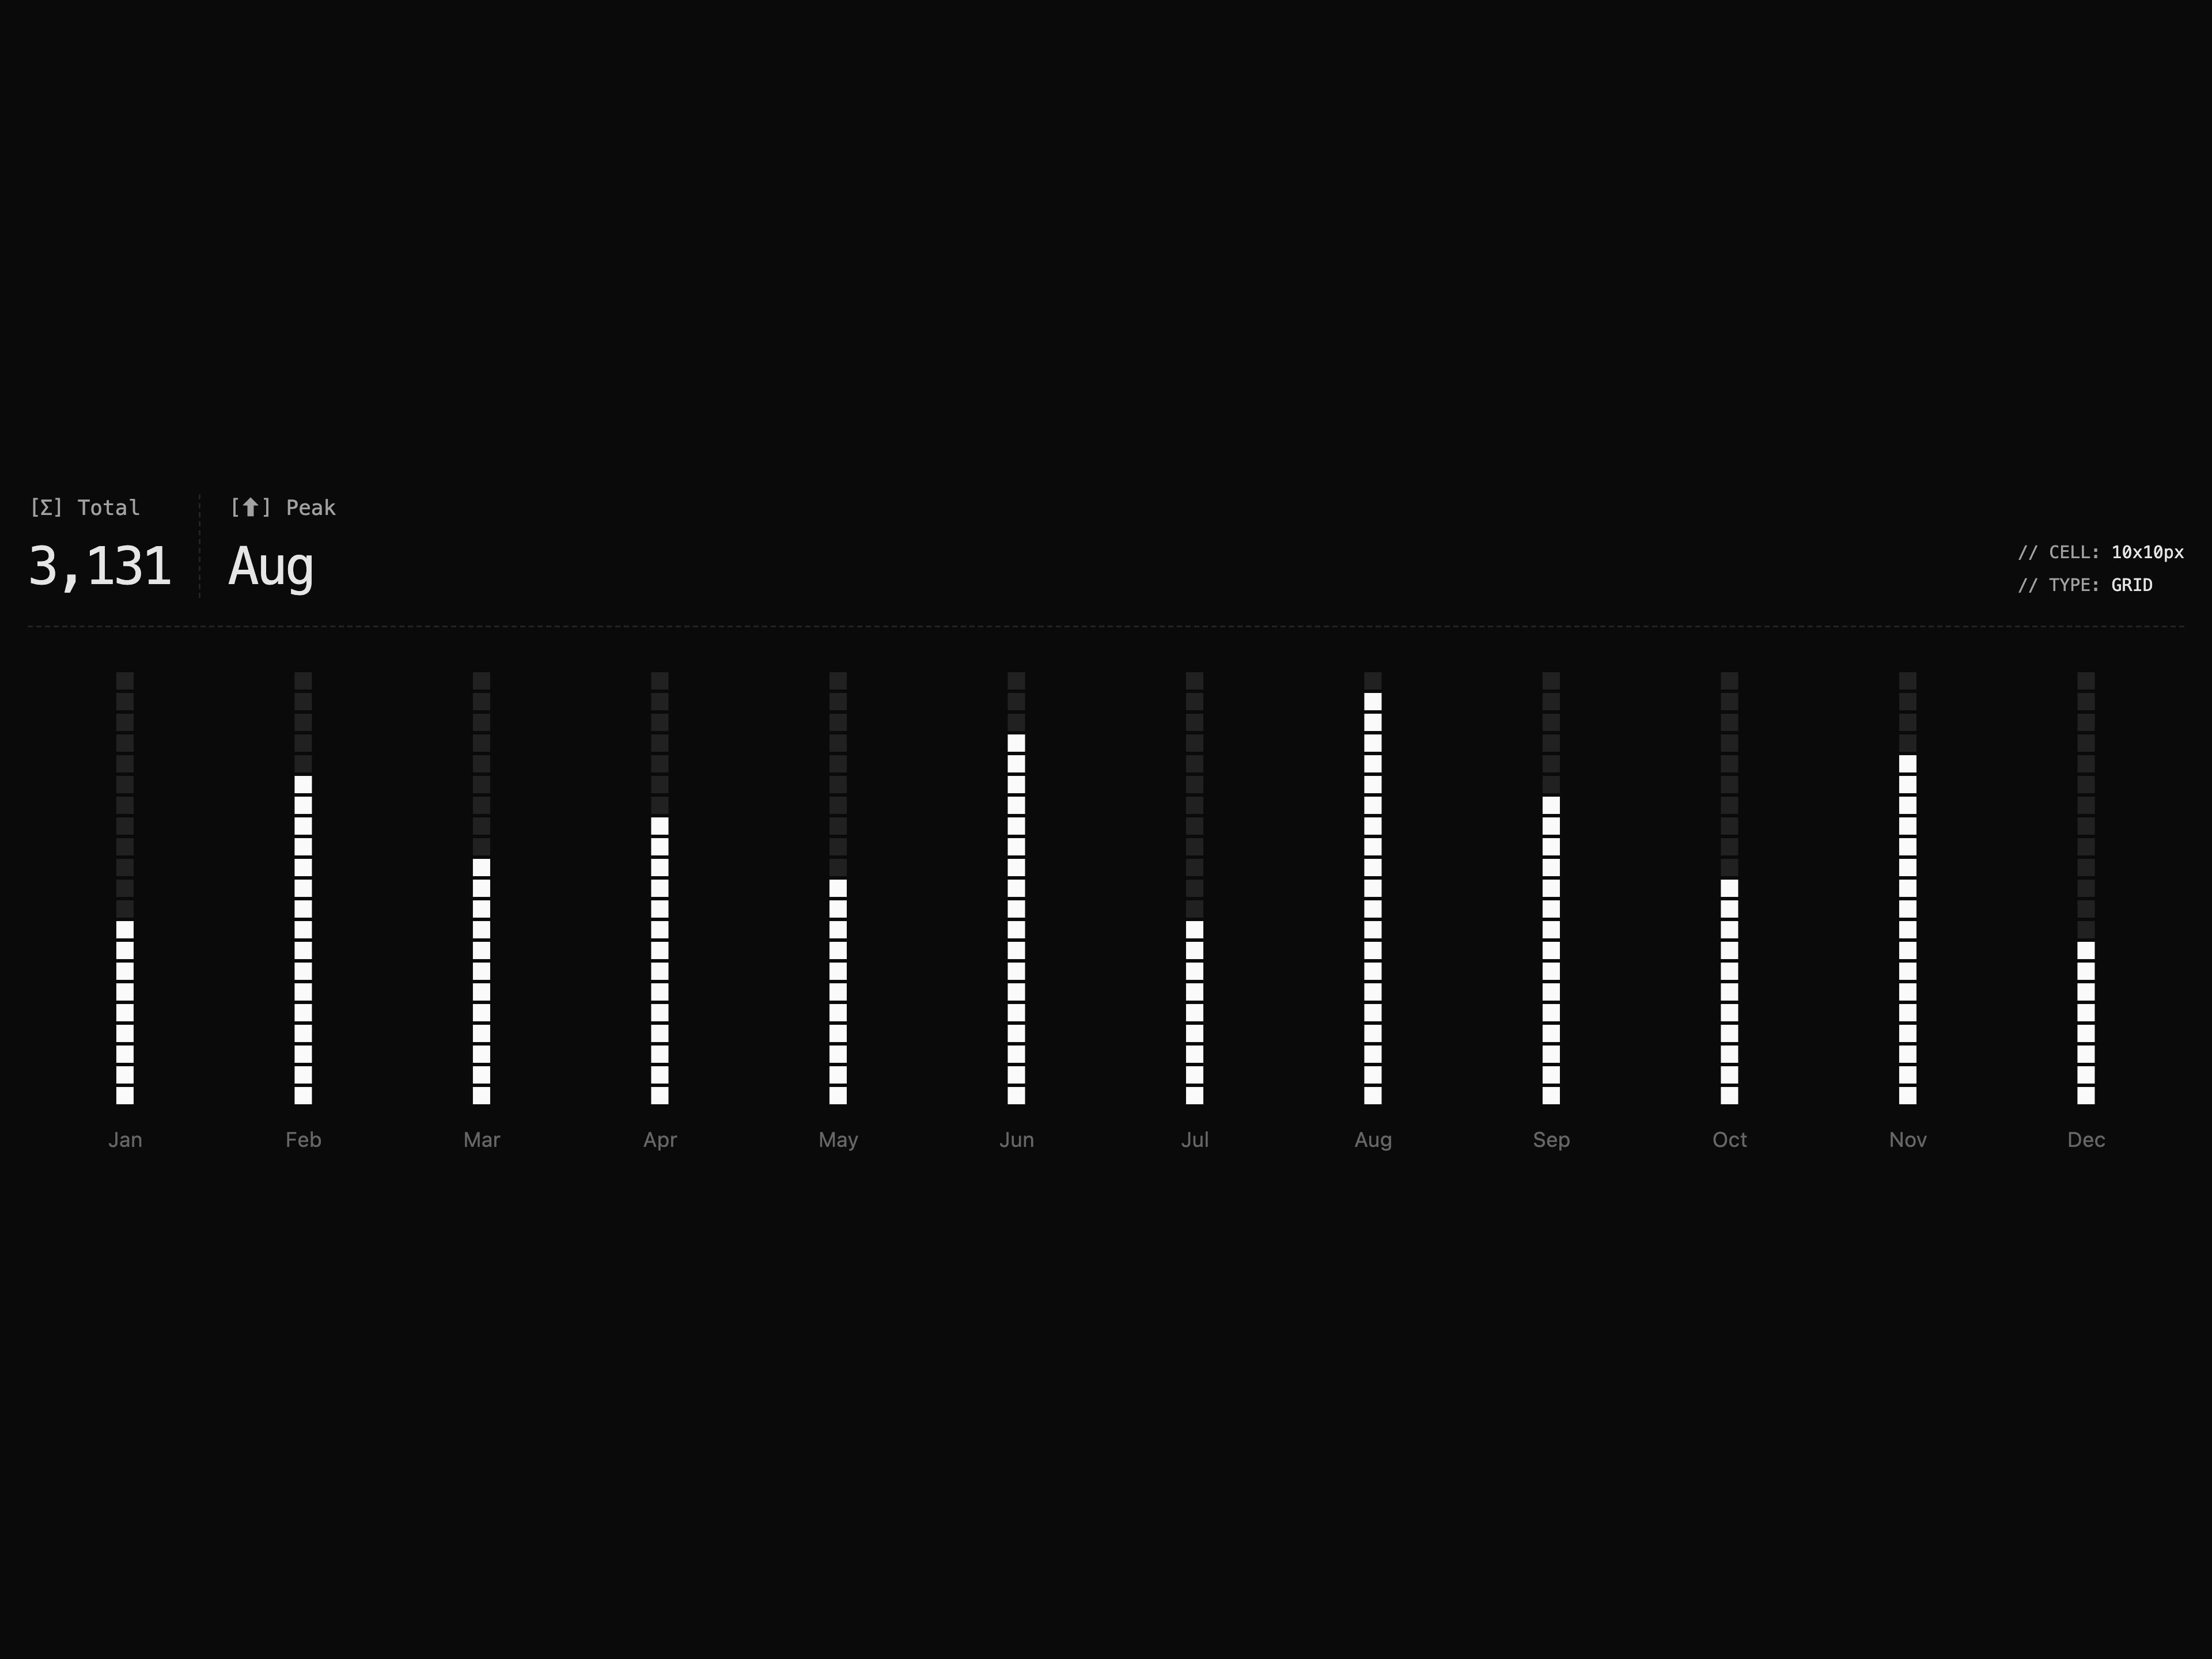
  • Grid Bar ChartGrid Bar Chart

    Grid Bar Chart

  • Chart Background

    Chart Background

  • Radar Chart

    Radar Chart

  • Radar Chart

    Radar Chart

  • Radar Chart

    Radar Chart

  • Pie Chart

    Pie Chart

  • Pie Chart

    Pie Chart

  • Pie Chart

    Pie Chart

  • Line Chart

    Line Chart

  • Line Chart

    Line Chart

  • About Evil Charts

    Evil Charts publishes a shadcn registry at evilcharts.com, with 57 components installable through the shadcn CLI.

    Components
    57
    GitHub stars
    3,183
    Last commit
    Oct 29, 2026
    Repository
    legions-developer/evilcharts

    Also in the Evil Charts registry

    Copy a prompt for your agent, copy the install command, or open the docs that ship it.

    • budget-echarts-radial-chart

      Budget breakdown card with four gauges and a value list, on the radial chart

      echarts, motion1 file
    • contributions-echarts-heatmap-chart

    • contributions-heatmap-chart

    • echarts-brush

      echarts1 file
    • echarts-chart

      echarts1 file
    • echarts-composed-chart

      Composed chart component rendered with Apache ECharts

      echarts, motion1 file14 examples
    • echarts-dot

      echarts1 file
    • echarts-heatmap-chart

      8 examples
    • echarts-legend

      1 file
    • echarts-radial-chart

      Radial chart component rendered with Apache ECharts

      echarts, motion1 file5 examples
    • echarts-tooltip

      echarts1 file
    • recharts-brush

      recharts1 file
    • recharts-chart

      recharts1 file
    • recharts-composed-chart

      Composed chart component combining bar and line charts

      recharts, motion1 file13 examples
    • recharts-dot

      recharts1 file
    • recharts-heatmap-chart

      7 examples
    • recharts-legend

      recharts1 file
    • recharts-radial-chart

      Radial bar chart component with full and semi-circle variants

      recharts, motion1 file4 examples
    • recharts-sankey-chart

      Sankey chart component for visualizing flow data with nodes and links

      recharts, motion1 file8 examples
    • recharts-tooltip

      recharts1 file
    • ride-echarts-radial-chart

      Activity summary card with a distance goal bar and three metric gauges

      echarts, motion1 file
    • sales-echarts-heatmap-chart

    • sales-heatmap-chart

    • workouts-echarts-heatmap-chart

    • workouts-heatmap-chart

    From the Evil Charts readme

    📊 EvilCharts

    Website: evilcharts.com

    A modern, customizable chart library for React and Next.js applications featuring visually stunning and interactive data visualizations.

    ✨ Features

    • 🎨 Beautiful pre-designed chart components
    • 🌈 Multiple chart types: Bar, Line, Area, Pie, Radar
    • ✨ Animated and interactive visualizations
    • 🎭 Customizable styles, patterns, and effects
    • 📱 Fully responsive design

    Contributing

    We welcome contributions! See CONTRIBUTING.md for guidelines on:

    • Adding new chart components
    • Reporting bugs and requesting features
    • Development setup and workflow

    Please read our Code of Conduct before contributing.

    Read the rest on GitHub →

    What Evil Charts shipped recently

    Every appearance and removal our crawl has seen in the registry index.

    • contributions-echarts-heatmap-chartaddedOct 29, 2026
    • contributions-heatmap-chartaddedOct 29, 2026
    • echarts-heatmap-chartaddedOct 29, 2026
    • ex-clickable-echarts-heatmap-chartaddedOct 29, 2026
    • ex-clickable-heatmap-chartaddedOct 29, 2026
    • ex-echarts-heatmap-chartaddedOct 29, 2026
    • ex-heatmap-chartaddedOct 29, 2026
    • ex-loading-state-echarts-heatmap-chartaddedOct 29, 2026
    • ex-loading-state-heatmap-chartaddedOct 29, 2026
    • ex-monday-start-echarts-heatmap-chartaddedOct 29, 2026
    • ex-monday-start-heatmap-chartaddedOct 29, 2026
    • area-chartremovedAug 19, 2026
    • backgroundremovedAug 19, 2026
    • bar-chartremovedAug 19, 2026
    • chartremovedAug 19, 2026
    • composed-chartremovedAug 19, 2026
    • dotremovedAug 19, 2026
    • evil-brushremovedAug 19, 2026
    • ex-glowing-radial-chartremovedAug 19, 2026
    • ex-glowing-sankey-chartremovedAug 19, 2026

    Registries like Evil Charts

    Bklit

    Bklit

    by bklitai

    5

    components

    Pace UI

    Pace UI

    by Pace UI

    12

    components

    Nimbus UI

    Nimbus UI

    by Guglielmo Giannattasio

    4

    components

    Browse every shadcn registry we track →

    1. Components
    2. /
    3. Legion Dev
    4. /
    5. Evil Charts

    Related libraries

    FR

    Freedom

    by Dhileep Kumar GM

    215

    components

    Efferd

    Efferd

    by Efferd

    115

    components

    MO

    Moderato

    by Hossain Jahed

    62

    components

    Circle

    Circle

    by LN

    23

    components

    shadcn/ui

    shadcn/ui

    by shadcn

    88

    components

    Be UI

    Be UI

    by Saurabh Chauhan

    72

    components

    About Evil Charts

    Evil Charts is a component library on 21st.dev by Legion Dev with 13 public React components. Every component ships with a live interactive preview and full TSX source — copy the code, install it through the shadcn CLI, or pull it into Cursor or Claude Code over MCP.

    All 13 Evil Charts components

    • Allocation Sankey Chart
    • Area Chart
    • Bar Chart
    • Cache Tiers Radial Chart
    • Chart Background
    • ECharts Sankey Chart
    • Grid Bar Chart
    • Hover Trace Bar Chart
    • Line Chart
    • Monospace Bar Chart
    • Pie Chart

    Browse all component libraries →

    Pipeline Sankey Chart
  • Radar Chart